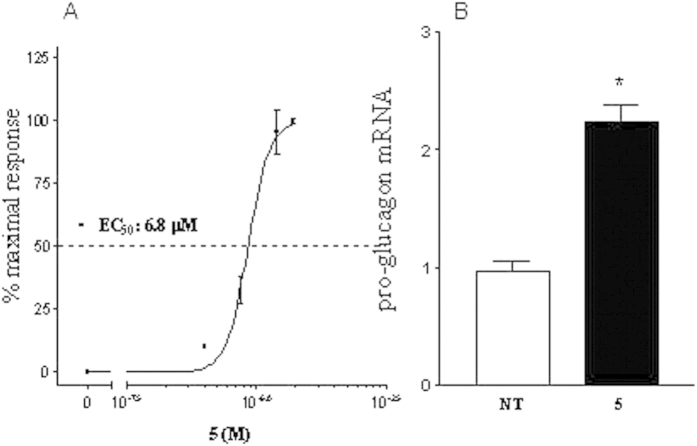
Figure 7. Concentration-response curve on GPBAR1 and RT-PCR experiments on GLUTAg cells.
(A) Concentration-response curve on GPBAR1 activation by compound 5. (B) Effect of 5 on relative mRNA expression of pro-glucagon in GLUTAg cells left untreated (NT) or stimulated with 10 μM compound 5. Values are normalized relative to GAPDH mRNA and are expressed relative to those of nontreated cells (NT), which are arbitrarily set to 1: *p < 0.05 vs NT.

