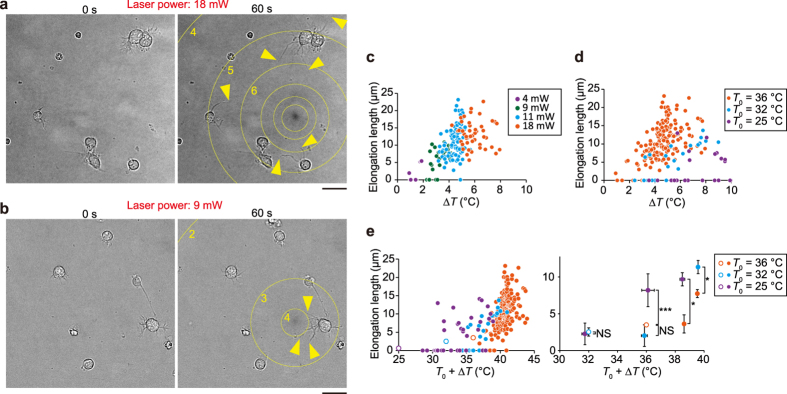
Figure 2. Neurite outgrowth in the presence of different temperature gradients.
(a,b) Bright-field optical micrographs of neurons heated by laser power of 18 mW (a) or 9 mW (b) for 60 s. Yellow arrowheads indicate neurites that elongated during heating. Circles indicate the isotherm (displayed >10 μm from the heat source). Numbers indicate the temperature change (ΔT; °C) from the T0. Scale bars, 20 μm. The T0 was 36 °C. The inhomogeneous brightness of the background was subtracted (see Supplementary Methods). See Supplementary Movies S6 and S7. (c) The relationship between ΔT and the elongation length after 60 s heat treatment at a T0 of 36 °C. Each colour corresponds to a different laser power. (d) The relationship between ΔT and the elongation length after 60 s at different T0. (e) The relationship between T0 + ΔT and the elongation length after 60 s at different T0. Left: Raw data from heat-treated cells (closed circles, T0 + ΔT) and average values from cells in the absence of heating (open circles, T0). Error bars, standard error of the mean (s.e.m). The elongation lengths were compared using t-tests (*p < 0.05, ***p < 0.001; NS, not significant). Each colour corresponds to a distinct T0. See also Supplementary Table S1.

