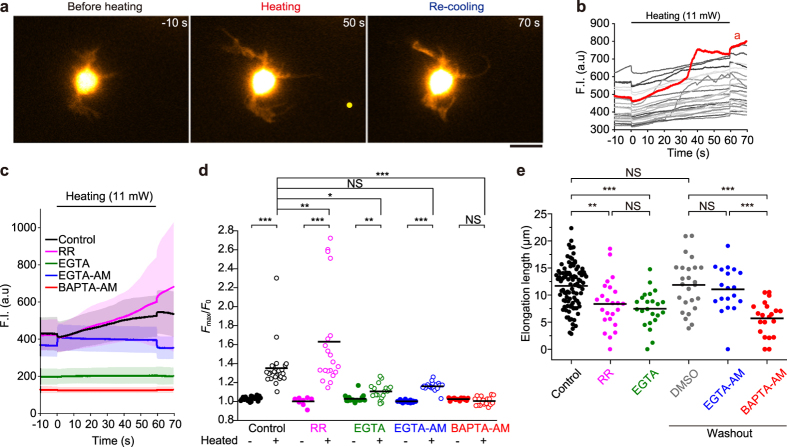
Figure 3. Involvement of Ca2+ in neurite outgrowth during microheating.
(a) Fluorescence images of a fluo-4-loaded neuron (1 DIV). Scale bar, 10 μm. A yellow circle indicates the position of the heat source. See also Supplementary Movie S9. (b) Time course analysis of the fluorescence intensity (F.I.) of fluo-4. The red line indicates the value obtained from the cell in (a). (c) Time course analysis of the average F.I. in the absence of chemical agents (Control), in the presence of 30 μM ruthenium red (RR) or 1.8 mM EGTA without extracellular Ca2+ (EGTA), and after pre-incubation (and washout) with 30 μM EGTA-AM or 50 μM BAPTA-AM. The extracellular Ca2+ concentration for each group, except the EGTA group, was 1.8 mM. Error bar, s.d. Each raw data is depicted in Supplementary Fig. S8. (d) The maximum value of the normalized F.I. (Fmax/F0) during heating, or without heating (see also Supplementary Fig. S8). Bars indicate average values. The Fmax/F0 values of non-heated cells were compared to those of heat-treated cells using t-tests (**p < 0.01, ***p < 0.001; NS, not significant). Each Fmax/F0 value for heated cells was compared to that for the control by one-way ANOVA with Tukey-Kramer tests (*p < 0.05, **p < 0.01, ***p < 0.001; NS, not significant). (e) Elongation lengths of neurites after the 60 s heat treatment under each condition. Bars indicate average values. The T0 was 36 °C, and the laser power was 11 mW. The ΔT was 4.9 ± 0.4 °C (means ± s.d.). Elongation lengths were compared using one-way ANOVA with Tukey-Kramer tests (*p < 0.05, ***p < 0.001; NS, not significant). See also Supplementary Table S2.

