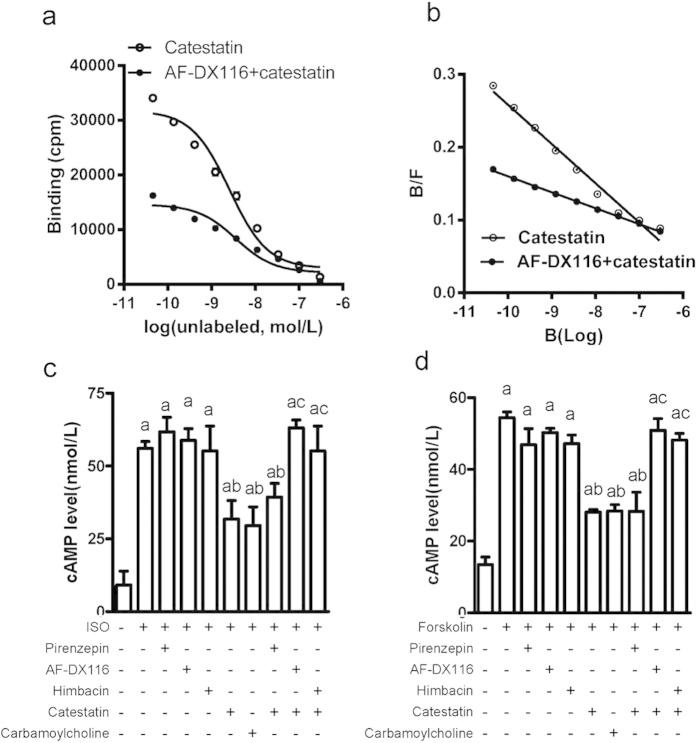
Figure 7. CST bound to M2 receptor and reduced cellular cAMP levels.
(a) Competitive inhibitory receptor binding curve involved [125-I]-labeled CST (0.4 μM) as a ligand, N-methylscopolamine (NMS, 0.045 nM to 0.3 μM) as “cold” ligand, and AF-DX116 as selective inhibitor. (b) Equilibrium dissociation constant (KD) values were counted by scatchard analysis. Selective M-receptor antagonist effect with CST on intracellular cAMP level after stimulation with isoproterenol (c) or forskolin (d). Data are mean ± SD. (a) P < 0.05 vs untreated group; (b) P < 0.01 vs single treatment with isoproterenol (ISO) or drugs; (c) P < 0.01 vs CST. Six independent experiments were performed for these studies.

