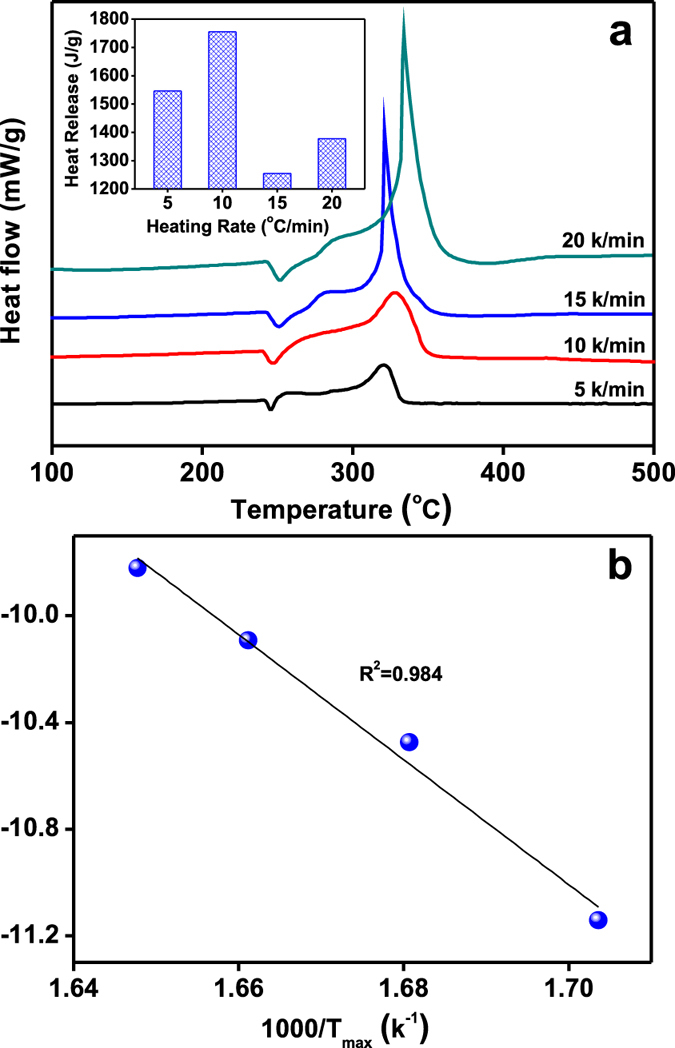
Figure 7.

(a) DTA curves of the mixture of AP and 25.0 wt% Cu@h-BN (mass ratio is 98:2) at different heat rates, (inset) corresponding heat release during the exothermic process, (b) ln (β/T2max) as a function of (1/Tmax). β and Tmax are the heating rate and the related summit peak temperature presented in (a), respectively.
