
Figure 4. Relationship between the relative amount of C4 species in diet as determined by metabarcoding and isotopic analyses of fecals.
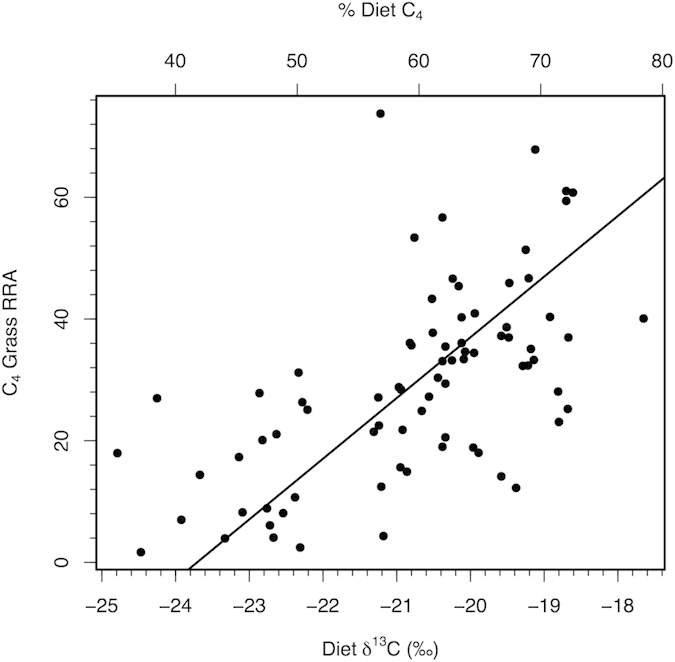
Isotopic data shown as fecal δ13C and % of diet at C4 species based on typical values for C3 and C4 species at the Kansas grassland. Data shown for 2011, 2013, 2014.