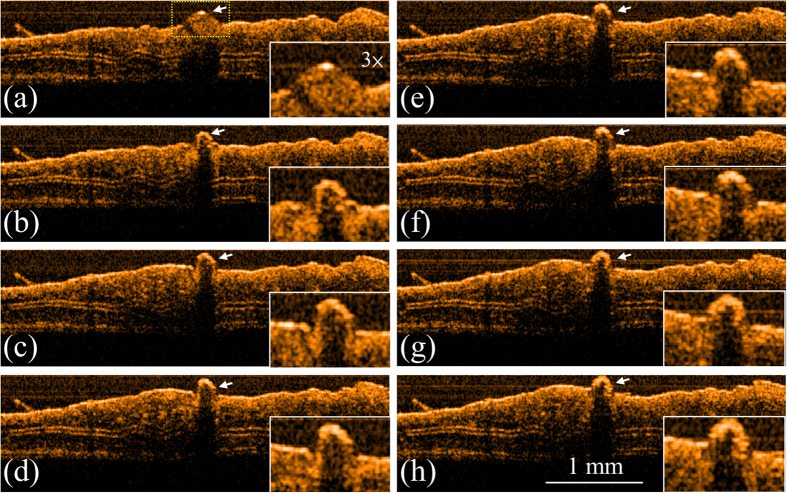
Figure 1. OCT results obtained for various exposure periods to 450-nm LD.
(a) Before exposure; after exposure for (b) 3, (c) 6, (d) 9, (e) 12, (f) 15, (g) 18, and (h) 21 s. The ball shape indicated by the white arrow represents the blood leakage from the vessel caused by the needle. The region indicated by the yellow square in (a) is enlarged as shown in the right-lower corners.

