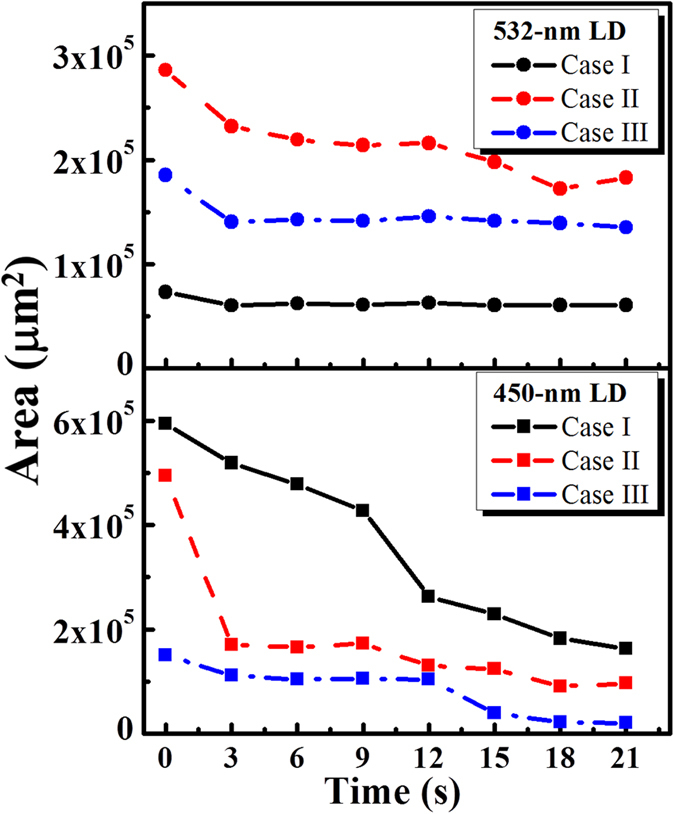
Figure 4.

Estimated areas of the blood drops before and after laser exposures at various time points. The representative results from mice exposed with either a 450-nm LD (n = 3) or a 532-nm LD (n = 3) are shown . The lower and upper figures represent the estimated areas of the blood drops with 450-nm and 532-nm laser exposures for various periods.
