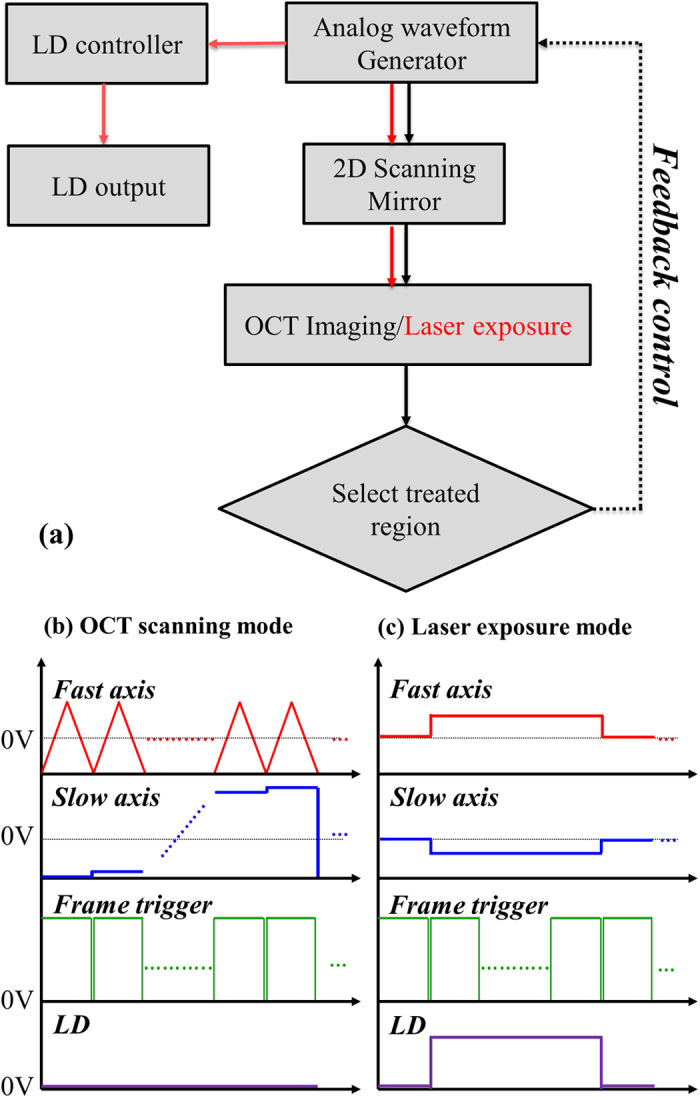
Figure 7.

(a) Flowchart of image-based feedback positioning for laser microsurgery, (b) OCT scanning mode, and (c) laser exposure mode. The red and blue curves are used to drive the fast and slow axes, respectively, of 2D scanning. The green curves represent the waveform used to trigger image acquisition. The purple curve is used to control the exposure period of the LD.
