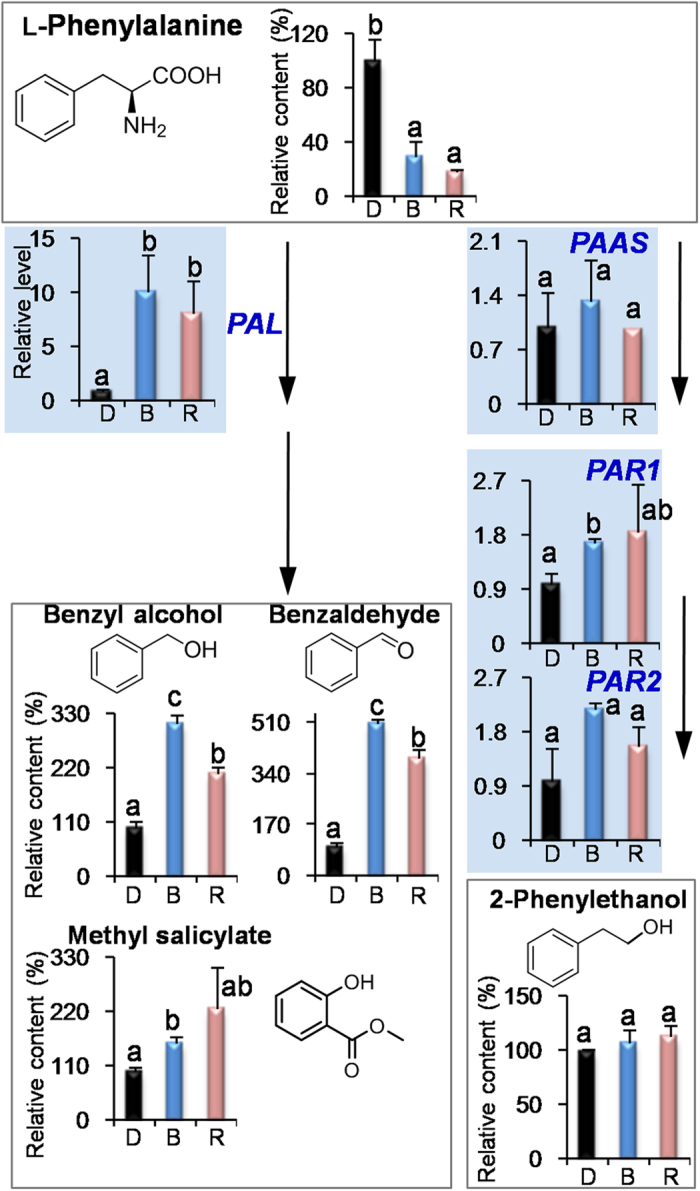
Figure 2. Effects of blue light and red light on the pathway leading from l-phenylalanine to volatile phenylpropanoids/benzenoids in preharvest tea leaves.

D, dark treatment. B, blue light treatment. R, red light treatment. PAL, phenylalanine ammonialyase. PAAS, phenylacetaldehyde synthase. PAR, phenylacetaldehyde reductases. All treatments on preharvest tea leaves were carried out for 3 days. The relative content (%) of metabolites was calculated based on the dark treatment (100%) as a control. The relative level of genes was calculated based on the dark treatment (1) as a control. Different means with different letters are significantly different from each other (p ≤ 0.05).
