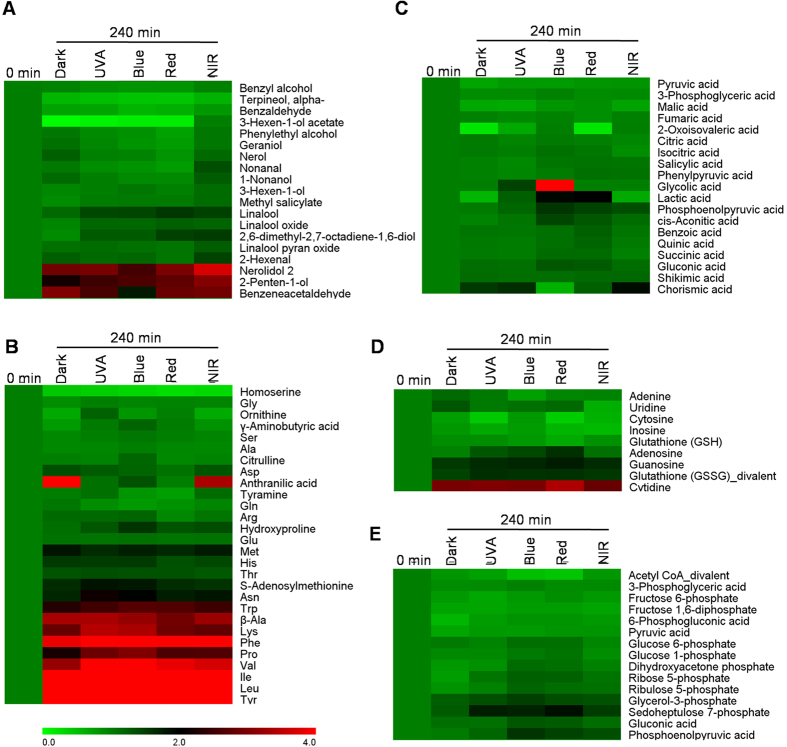
Figure 4. Comparison of metabolites in 0 min and 240 min treatments of dark, UVA, blue light, red light, and near-infrared (NIR) on postharvest tea leaves.
(A) volatiles. (B) amino acids. (C) organic acids. (D) alkaloid. (E) metabolites involved in glycolysis and pentose pathways. The 0 min treatment was normalized as 1. The data were calculated based on mean values (n = 3). The data for making this figures is shown in Tables S3 and S4 (Supplementary information). Full names of metabolites are given in Table S5.

