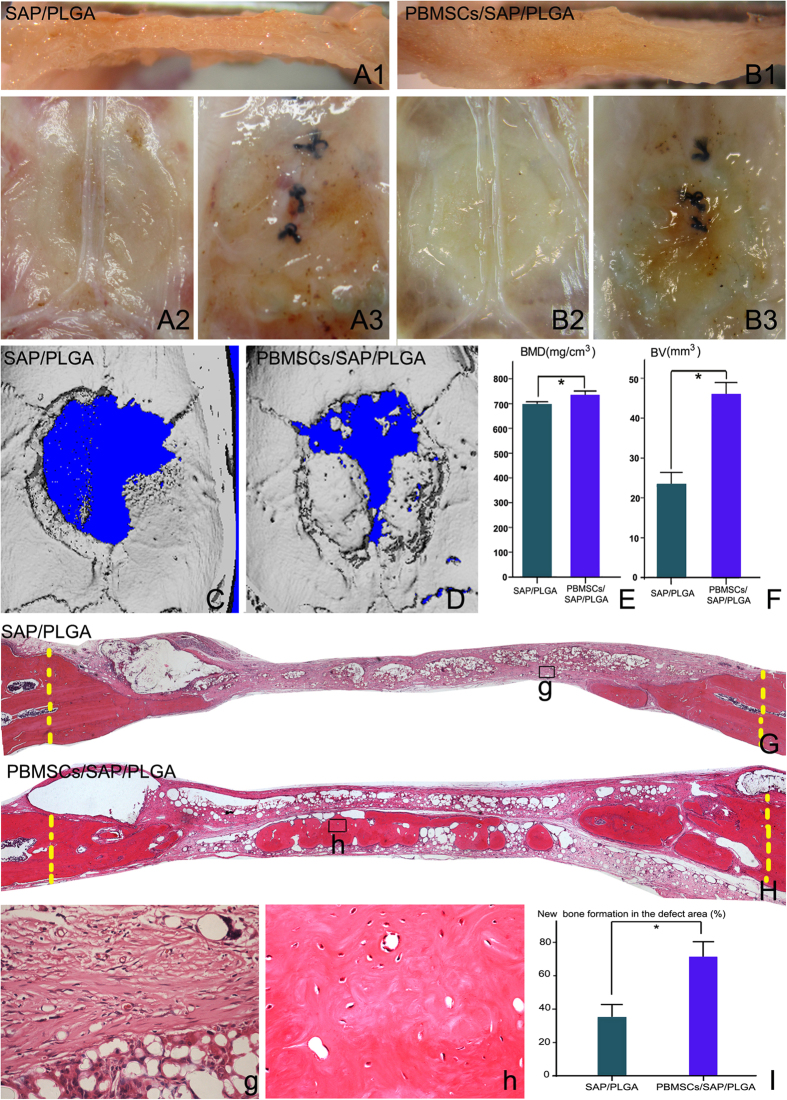
Figure 5. The healing of bony defect and new bone formation.
(A,B) gross images of the samples harvested at 12 weeks after the cranial defect was transplanted with SAP/PLGA or PBMSCs/SAP/PLGA scaffold. The images of cross-section in the midline of defect area (A1,B1), views of intracranial side (A2,B2) and extracranial side (A3,B3) indicated both of SAP/PLGA and PBMSCs/SAP/PLGA grafts were integrated smoothly with the host. Micro-CT images showing the minerazation in PBMSCs/SAP/PLGA (C) and SAP/PLGA (D) grafted subjects at 12 weeks post surgery. (E,F) Statistical quantifications of the bone mineral density (BMD) and bone volume(BV) in the defect area assessed by micro-CT. (G,g,H,h) the whole and local images of H&E staining of cranial defect at 12 weeks post surgery (G,g), SAP/PLGA grafted; (H,h) PBMSCs/SAP/PLGA grafted), (I) Statistical quantifications of the percentage of new formed bone in the defect area assessed by H&E staining.

