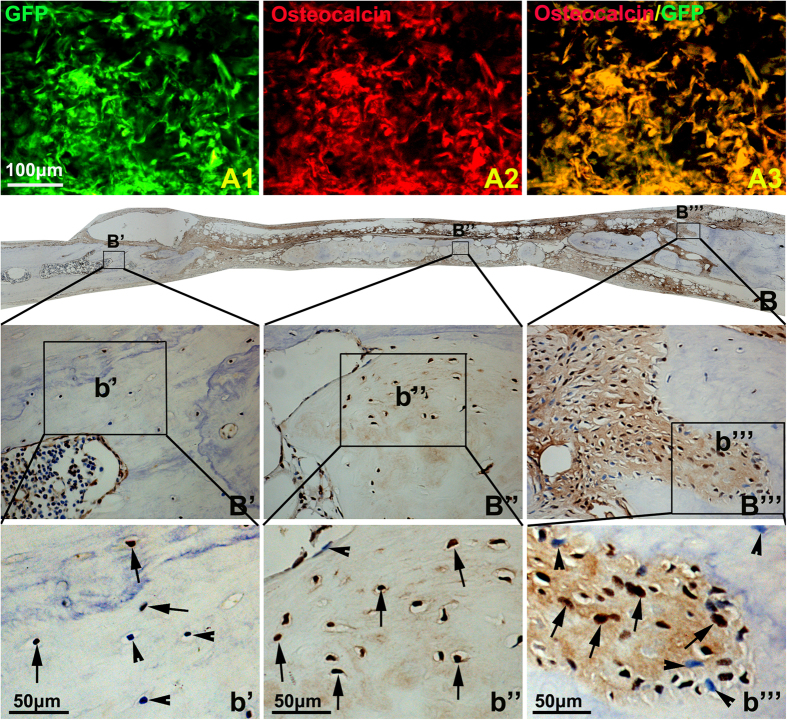
Figure 6. The survival and osteogenesis of grafted PBMSCs in the bony defect area.
(A) Lots of GFP positive graft cells were detected in the bony defect area 2 weeks post-implantation (A1), and these cells were positive for osteocalcin (A2), A3 is the merged image of A1 and A2. (B) BrdU immunohistochemistry showing lots of BrdU labeled graft cells were embedded by new formed bone matrix. In order to show the details in different areas, local images were step by step amplified and showed in (B’–B”’) and (b’–b”’). In the central area, almost all of the osteocytes in the new formed bone were BrdU positive (arrows),while in the edge of defect area, both of BrdU positive (arrows) and negative (arrow heads) osteocytes were located in the new formed bone.

