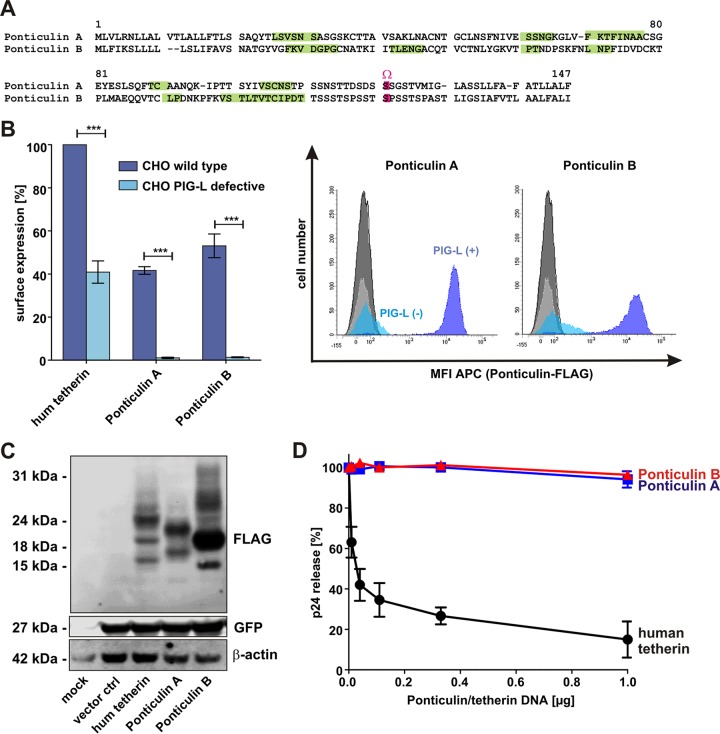
FIG 5.
Functional characterization of ponticulin A and B. (A) Amino acid alignment of ponticulin A and B from the slime mold Dictyostelium discoideum. Dashes indicate gaps that were introduced to improve the alignment. β-Sheets were predicted using PSIPRED v3.3 and are highlighted in green; the GPI anchor attachment site (Ω site) is shown in pink. (B) Flow cytometric analysis of ponticulin levels at the surface of transfected CHO cells (wt or PIG-L deficient). The means of the results of three to five independent experiments ± SEM are shown on the left (***, P < 0.001). Examples for primary FACS data indicating the mean fluorescence intensity (MFI) of allophycocyanin (APC) are shown on the right. hum, human. (C) Western blot analysis of HEK293T cells transfected with expression vectors for human tetherin or ponticulin A or B. An anti-FLAG antibody was used for detection. β-Actin and eGFP served as loading and transfection controls, respectively. (D) Virus release from HEK293T cells cotransfected with a vpu-deficient proviral construct of HIV-1 NL4-3 and increasing amounts of expression vectors for human tetherin or ponticulin A or B. Two days posttransfection, cells and supernatants were harvested and p24 contents were determined by ELISA. Virus release was calculated by dividing the amount of viral capsid in the supernatant by the total amount. The means of the results of five to seven independent experiments ± SEM are shown.

