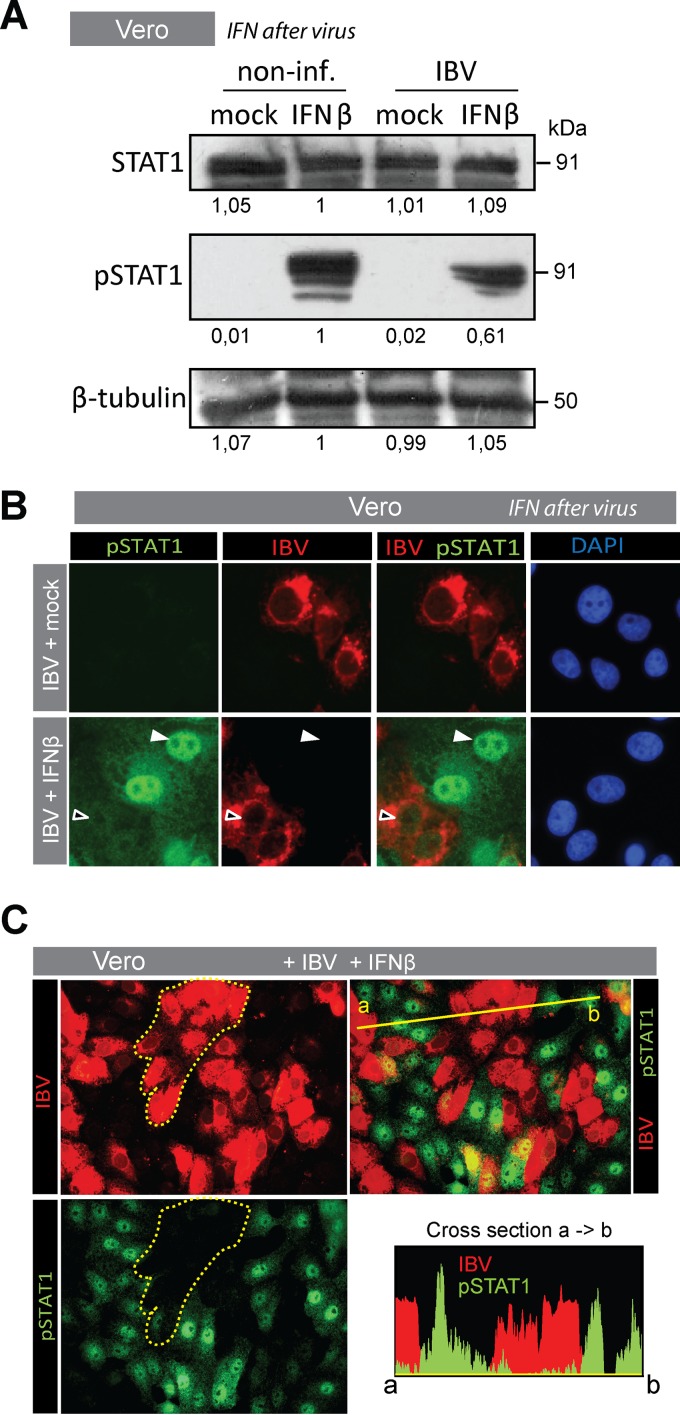
FIG 3.
IBV prevents translocation and phosphorylation of STAT1 Vero cells were infected for 18 h with IBV Beau-R (MOI of 0.1) and subsequently stimulated with 1,000 U/ml of IFN-β for 30 min. (A) Western blot analysis of noninfected and IBV-infected monolayers that were either mock treated or treated with IFN-β. Staining was performed using antibodies against STAT1 and Tyr701-phosphorylated STAT1. Staining against β-tubulin was included as a loading control. Numbers below the blots indicate the intensities of the bands, expressed as fold ratio relative to the IFN-β-stimulated, noninfected sample. (B) Vero cells treated as described above were fixed and stained for IBV-N and pSTAT1. White arrowheads indicate translocation of pSTAT1, and black arrowheads indicate absence of pSTAT1 from the nucleus. (C) To verify the overall decrease of pSTAT1, an area containing IBV-infected cells within an IFN-β-stimulated monolayer is delineated by a dotted line in the top left image and is overlaid on the bottom left image to illustrate the absence of pSTAT1 in IBV-infected cells. Cross section: fluorescence intensity plot of pSTAT1 and IBV-N along the yellow line indicated in the top right image.

