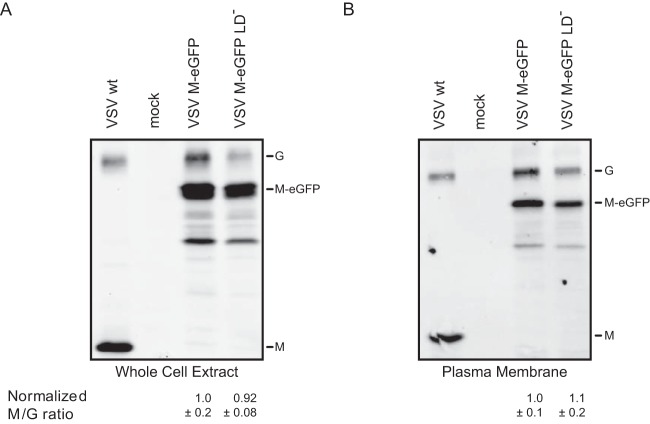
FIG 8.
Comparison of the cellular expression and presence at the plasma membrane of M with and without functional late domains. BSR T7/5 cells were infected at an MOI of 20, and the whole-cell extract (A) or plasma membrane (B) was extracted at 7 hpi. The amounts of G and M present were determined by Western blotting. By using G as a loading control, the amount of M expressed in cells or present at the plasma membrane was quantified. SEMs (n = 3) are shown.

