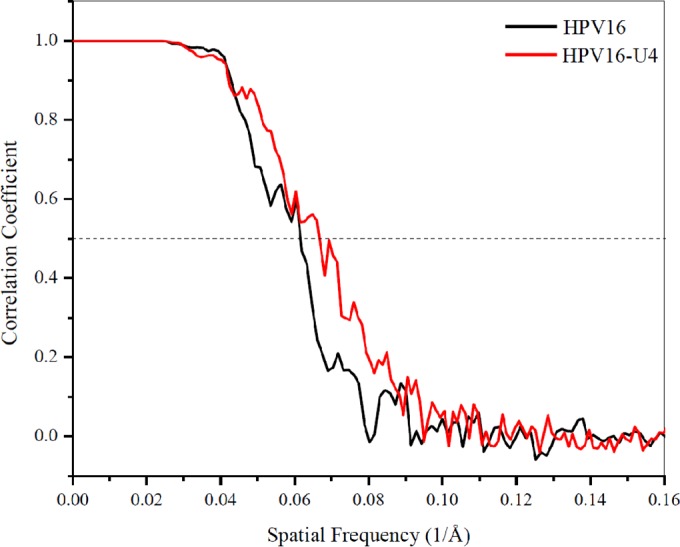
FIG 2.

Plot showing the Fourier shell correlation (FSC) versus spatial frequency of the icosahedrally averaged reconstructions for HPV16 and HPV16-Fab complex. The resolution of the reconstructions was assessed where the FSC curve crossed a correlation value of 0.5.
