
FIG 2.
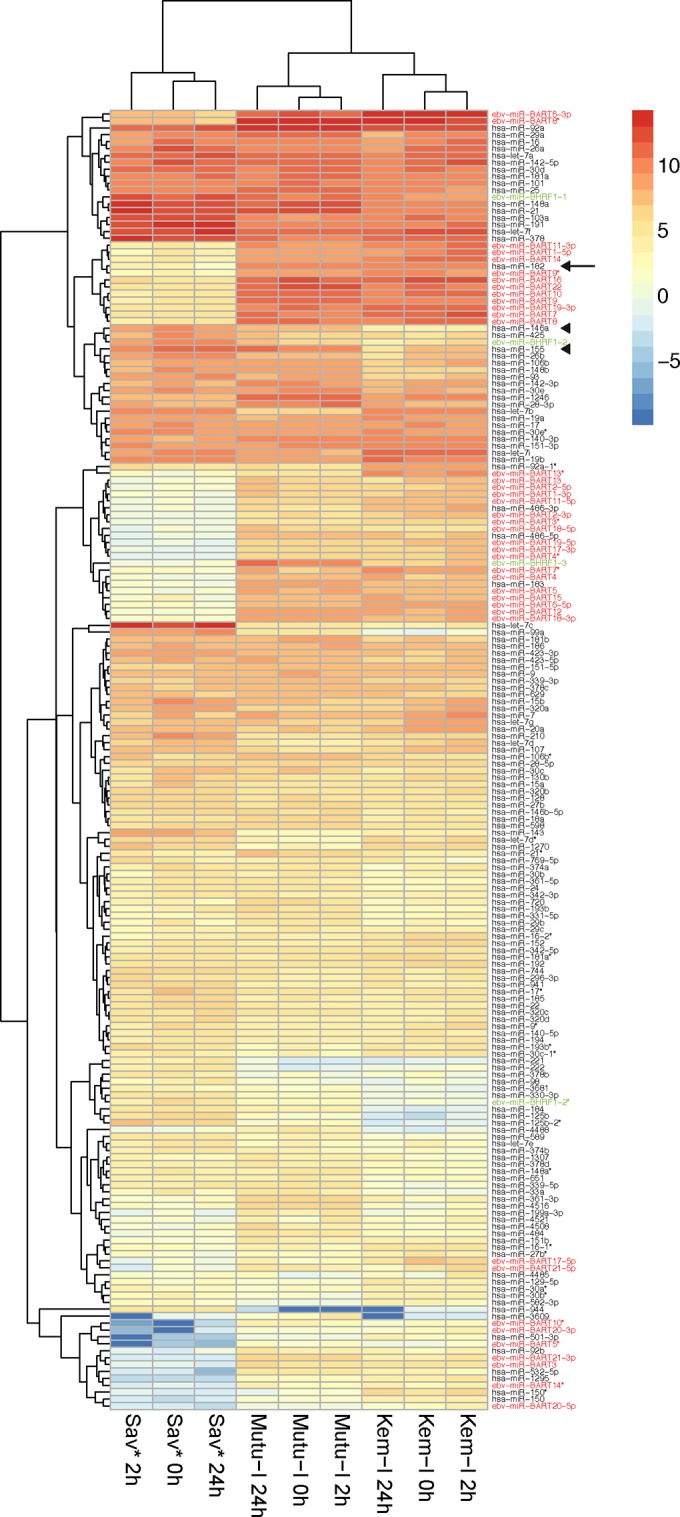
Cellular and viral miRNA profiling in EBV-positive BL cell lines. The heat map shows hierarchical clustering of the different samples and of the 100 most abundant cellular miRNAs and viral miRNAs in each sample on the basis of their expression profile. High relative miRNA expression (log2 transformed) is indicated by red shading and low expression by blue shading. BART miRNAs are indicated in red, BHRF1 miRNAs are indicated in green, miR-182 is indicated by an arrow, and miR-146a and miR-155 are indicated by arrowheads. hsa, Homo sapiens.