FIG 5.
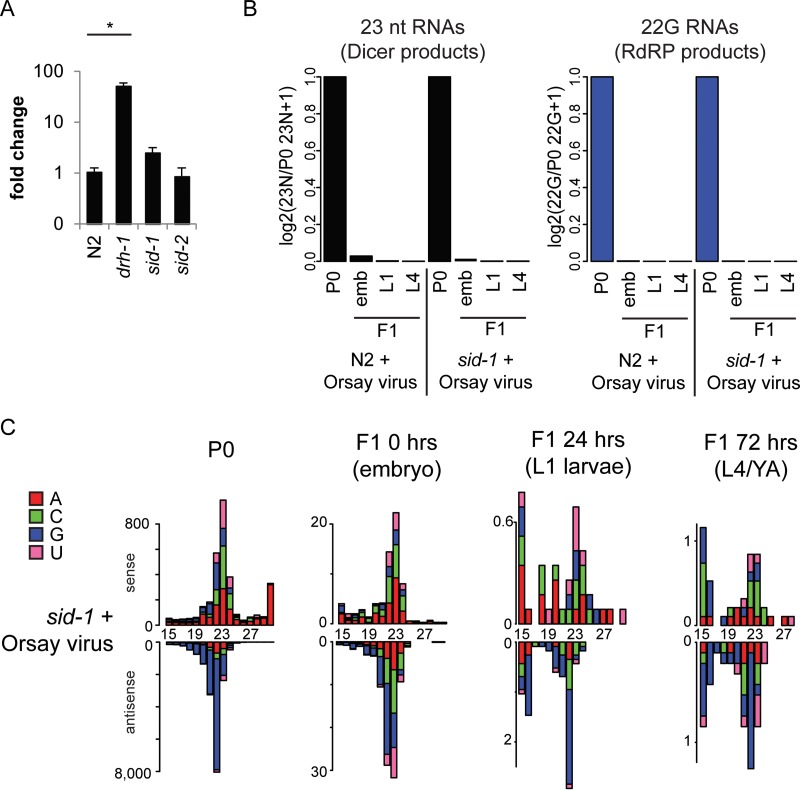
sid-1 and sid-2 are not required for viral resistance. (A) qRT-PCR showing the relative levels of Orsay virus 4 days after infection in N2 and in drh-1, sid-1, and sid-2 mutants. drh-1 mutant animals show significantly higher levels of Orsay virus RNA than N2 animals do (P < 0.05, t test), but there is no significant difference between either sid-1 or sid-2 mutant and N2 animals. Data were normalized to gapdh and then N2. (B) Shown are the 23-nt sense (left) Dicer products and 22G antisense (right) secondary RNAs from panel C (sid-1) and Fig. 1 (N2) normalized to library size and the level in the P0 generation. emb, embryo. (C) 5′ independent small RNA sequencing of P0 and F1 sid-1 mutant animals after Orsay virus exposure. P0 animals were assayed as a mixed-stage population of predominantly adults, and F1 animals were synchronized and assayed at three different ages as indicated. Data are shown as sense or antisense and ordered according to the size of the RNA molecule. The values on the y axis are reads per million. The 5′ nucleotide is indicated by color as follows: red, A; green, C; blue, G; pink, U.

