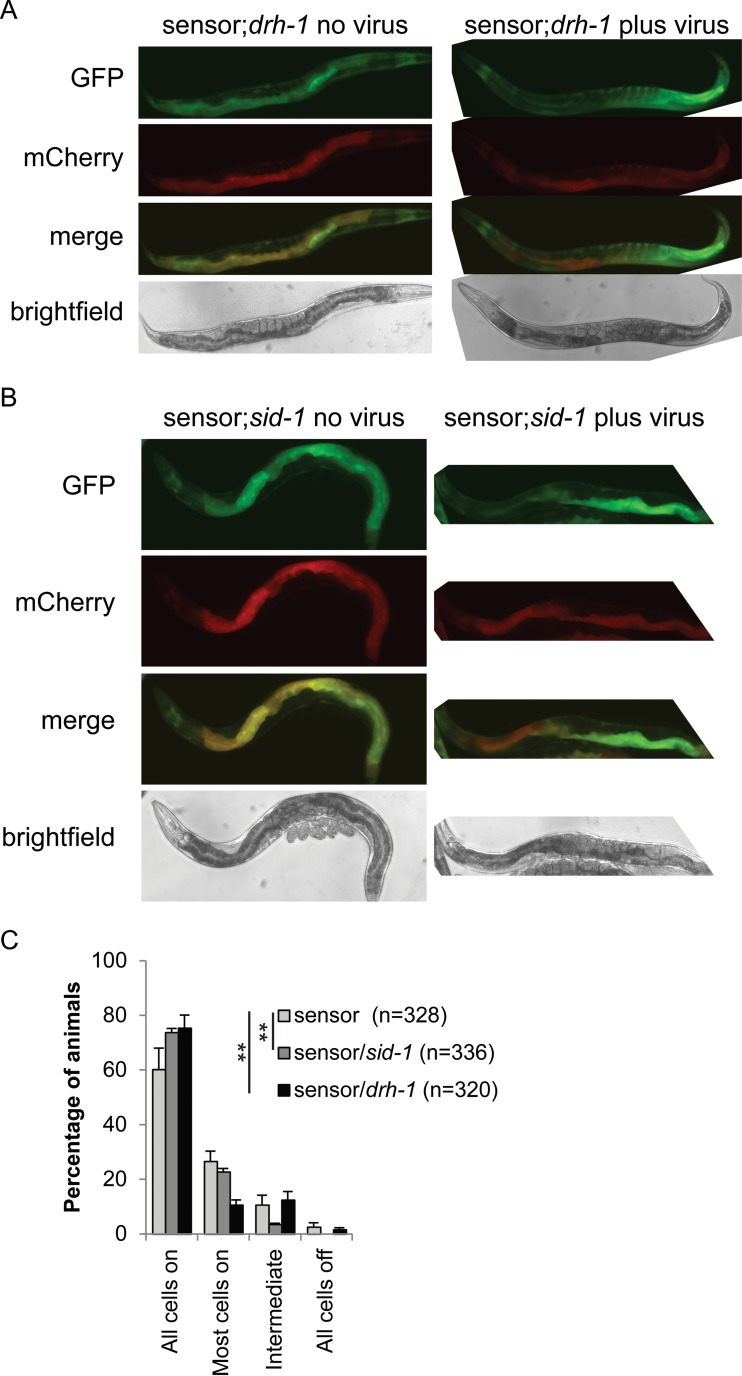
FIG 6.
Orsay virus sensor in the sid-1 and drh-1 mutant backgrounds. (A, B) Orsay virus sensor showing representative uninfected (left) and infected (right) animals. Infected- and uninfected-animal images were taken at the same intensity. (C) Percentages of sensor N2 (light gray), sid-1 mutant (gray), and drh-1 mutant (black) animals showing the amounts of silenced intestinal cells indicated in the presence of Orsay virus. The amount of intestinal cell silencing differs significantly between both the sid-1 and drh-1 mutant backgrounds and the wild-type background (P < 0.001 [Fisher's exact test] in both cases). Error bars represent the standard error of the mean of six biological replicates.

