FIG 8.
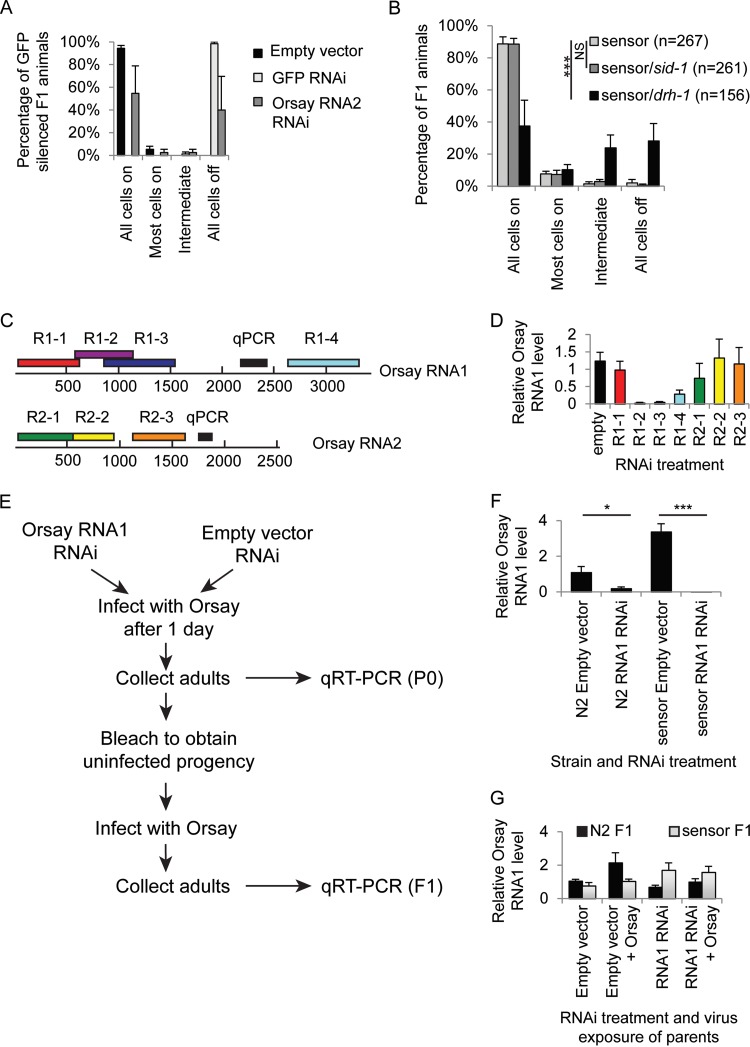
RNAi-induced Orsay virus silencing. (A) Graph showing the percentages of F1 animals with inherited sensor silencing after parental exposure by feeding to RNAi against either the empty vector (black), GFP (light gray), or OrsayRNA2 (dark gray). Error bars represent the standard error of the mean of two biological replicates. (B) Sensor silencing in the F1 offspring of infected animals (as judged by sensor silencing). The values on the x axis are the percentages of N2 (light gray), sid-1 mutant (dark gray), and drh-1 mutant (black) animals with the indicated amounts of sensor silencing in the intestine. ***, P < 0.0005 (Fisher's exact test). (C) Cartoon showing the position on the Orsay virus genome of the RNAi clones used in panel D and the positions of the quantitative PCR (qPCR) amplicons. (D) Graph showing the relative levels of Orsay virus (4 days postinfection) measured by qRT-PCR in N2 animals fed the RNAi clones indicated. Error bars represent the standard error of the mean of 3 (R1-1, R1-2, R2-1), 6 (R1-3, R1-4, R2-2, R2-3), or 12 (empty) biological replicates. (E) Schematic illustrating the experimental design used to test for the presence or absence of viral resistance in the F1 generation caused by previous viral exposure, viral RNAi, or both. (F) Graph showing the relative Orsay virus levels measured by qRT-PCR in P0 animals 4 days after Orsay virus exposure. Animals were wild type or carried an OrsayRNA1 sensor transgene and were exposed to either the empty vector or OrsayRNA1 RNAi. Exposure to Orsay virus RNAi in the P0 generation causes resistance to Orsay viral infection in both genetic backgrounds, although the effect is more significant in the sensor background. Data were normalized to gapdh and then the N2 empty vector. *, P < 0.05; ***, P < 0.0005 (t test). Error bars represent the standard error of the mean of three biological replicates. (G) Relative OrsayRNA1 levels in F1 animals. The x axis shows the RNAi treatment and/or Orsay exposure of their parents. N2 animal are shown in black, and RNA1 sensor animals are in light gray. There is no significant difference in any treatment or strain. Data were normalized to gapdh and then the N2 F1 empty vector. Error bars represent the standard error of the mean of three biological replicates.

