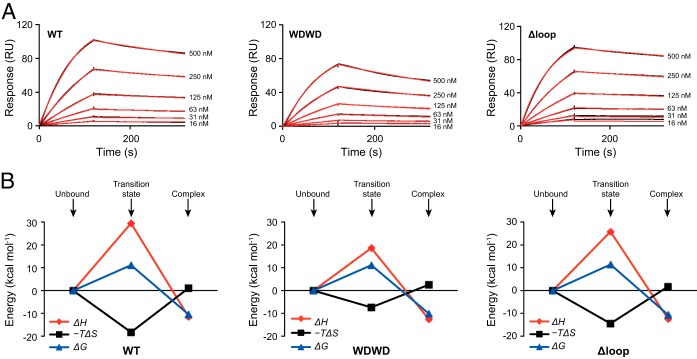
FIG 4.
Kinetic and thermodynamic characterization of Fab-peptide binding by SPR. (A) Sensorgrams corresponding to the binding of 4E10ep (analyte) to a surface decorated with WT, WDWD, or ΔLoop Fabs (immobilization levels were ∼1,400 RU). The concentration of peptide injected in each run is indicated. Black and red curves correspond to the experimental data and best fit (using the Biacore T200 evaluation software), respectively. (B) Evolution of the thermodynamic parameters along the reaction coordinate. Thermodynamic parameters corresponding to the transition state and at equilibrium were obtained from the temperature dependence of kon and KD using the Eyring and van't Hoff equations, respectively. The change in Gibbs energy (ΔG), change in enthalpy (ΔH), and change in entropy (−TΔS) are shown in blue, red, and black, respectively. Values are given in Table 4.

