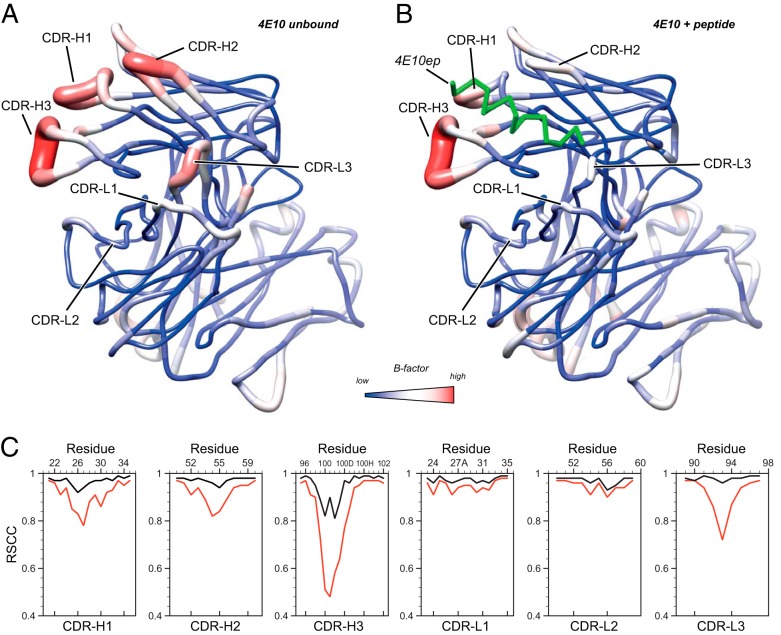
FIG 5.
Comparison of the ligand-bound and ligand-free forms of 4E10 Fab. Sausage (tubular) representation of B-factors of ligand-free (A) and ligand-bound (B) 4E10 Fab. Higher B-factors are depicted by red and thick tubes. For the unbound form of 4E10, the blue-white-red gradient corresponds to B-factor values of 12.6, 36.6, and 100.9 Å2, respectively. For the peptide-bound form, the blue-white-red gradient corresponds to B-factor values of 21.8, 40.0, and 90.2 Å2, respectively. These values correspond to the minimum, a midpoint, and the maximum B-factor values of each crystal structure. Both molecules are oriented to display the paratope CDR loops at the front plane. In panel B, the bound peptide is represented with a green ribbon. (C) Per-residue real-space correlation coefficient (RSCC; a measure of the fit between the model and the experimental electron density) of the six hypervariable loops of 4E10 Fab in the unbound (red) and bound (black) state. Lower correlation values indicate less agreement between the model and the experimental electron density, suggesting the regions with lower RSCC are more dynamically disordered. The RSCC values were calculated using PHENIX (30).

