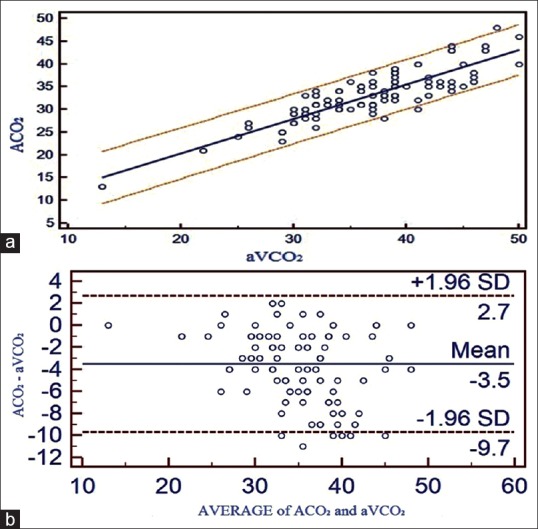
Figure 2.

(a) Correlation between adjusted central venous blood gas and arterial blood gas values and linear regression with 95% confidence interval lines on both sides for pCO2. (b) Bland Altman bias plots of adjusted central venous blood gas and arterial blood gas for pCO2 showing mean difference and 95% limits of agreement (ACO2 = arterial pCO2, aVCO2 = adjusted central venous pCO2)
