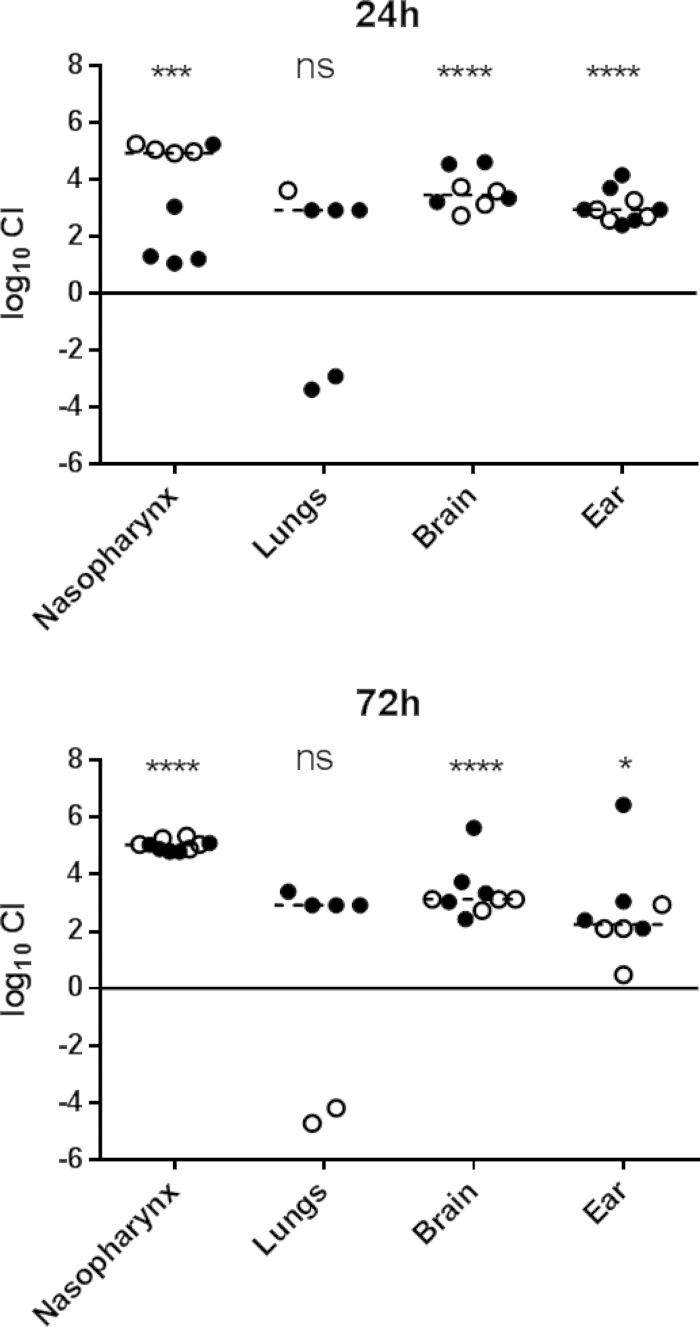
FIG 2.
In vivo competition between ST15/9-47 (ear isolate) and ST15/4495 (blood isolate). Data shown are pooled from two competition experiments performed with 5 mice per group for each time point (24 h and 72 h postchallenge). In one experiment, mice were challenged with equal numbers (5 × 10⁷ CFU each) of ST15/4495 and ST15/9-47:pAL3 (open symbols); in the other experiment, mice were challenged with equal numbers of ST15/4495:pAL3 and ST15/9-47 (solid symbols). The competitive index (CI) is shown as log10 CI for each tissue of each mouse. The horizontal dotted lines denote the geometric mean CI for each tissue. Statistical differences between the log-transformed geometric mean CI and a hypothetical value of 0 (ratio of 1:1) in each niche were analyzed using the two-tailed Student's t test. ns, not significant; *, P < 0.05; ***, P < 0.001; ****, P < 0.0001.

