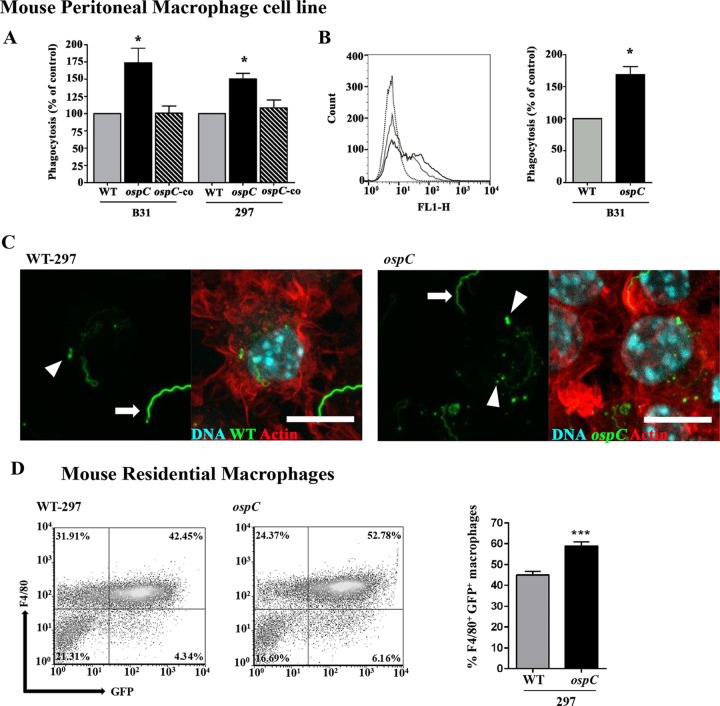
FIG 4.
Abrogation of OspC enhances phagocytosis of B. burgdorferi by murine macrophages. (A) Quantitation of phagocytosis of GFP-expressing spirochetes (strains B31 and 297) by murine peritoneal macrophages (PMs) determined using a microplate fluorometer. PMs were incubated with GFP-expressing spirochetes at an MOI of 100 for 2 h. The phagocytic index (PI) represents the fluorescence of intracellular bacteria phagocytosed by macrophages. Data are representative of three or four separate experiments with at least 4 replicates per experiment. Values are means and SEM. Comparisons among experimental groups were performed with one-way ANOVA followed by Dunnett's post hoc test (*, P < 0.05). (B) Representative histograms of phagocytosis of B31-A3-gfp (gray solid line) and ospC-gfp (black solid line) spirochetes analyzed by flow cytometry. PMs were incubated with GFP-expressing spirochetes at an MOI of 100 for 2 h, followed by washing and fixation prior to flow-cytometric analysis. The black dotted line represents control unstained cells. The percent phagocytosis is shown on the right. Data are the percentage of GFP-expressing spirochetes phagocytosed by PMs obtained from three separate experiments (Student's t test; *, P < 0.05). Values are means and SEM. (C) Confocal z-stack images of murine peritoneal macrophages incubated with GFP-expressing B. burgdorferi spirochetes for 2 h at an MOI of 100:1. The left image shows wild-type spirochetes (strain 297) associated with a macrophage. The arrowhead indicates a bright green fluorescent bleb that appears to be internalized in a macrophage, and the arrow indicates a cell surface-associated spirochete which is mainly extracellular. The right image shows ospC mutant spirochetes (strain 297) associated with a macrophage. The arrowheads indicate bright fluorescent blebs that appear to have been recently internalized and/or fully degraded into a macrophage, and the arrow indicates a cell surface-associated spirochete which is in the process of being phagocytosed. Cell nucleus DNA (cyan in overlay) was stained with DAPI, and F actin (red in overlay) was stained with phalloidin (bar, 10 μm). The images are representative of three biological replicates. (D) Representative plots of murine residential peritoneal macrophages isolated from C57BL/6 mice and incubated with GFP-expressing spirochetes (wild-type strain 297 or ospC mutant) for 2 h at an MOI of 100:1. Macrophages were gated according to their expression of the F4/80 membrane glycoprotein. The dot plot in each upper right quadrant shows the F4/80+ and GFP+ profile for macrophages. The percent F4/80+ GFP+ residential macrophages from six mice is shown on the right. Data are the percentage of GFP-expressing spirochetes associated with F4/80+ macrophages isolated from six mice (Student's t test; ***, P < 0.0005). Values are means and SEM.

