FIG 2.
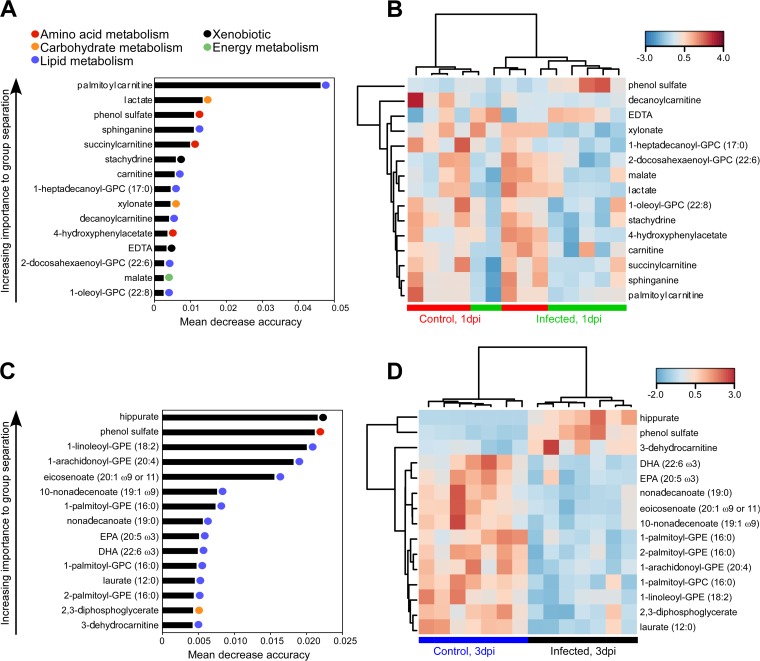
Random forest (RF) analysis of metabolite changes in blood of animals infected with B. anthracis vegetative cells. Mice were infected with vegetative cells via a subcutaneous route (see Materials and Methods). Data represent mean decrease accuracy and hierarchical clustering by heat map analysis of control and infected blood for the top 15 metabolites at 1 dpi (A and B) and 3 dpi (C and D) determined using Pearson rank correlation distance and complete linkage. Heat map colors reflect relative abundances of metabolites identified by random forest analysis. Red or blue is used to show that the abundance of the indicated metabolite was higher or lower than the mean metabolite abundance, respectively. GPC, glycerophosphocholine; GPE, glycerophosphoethanolamine.

