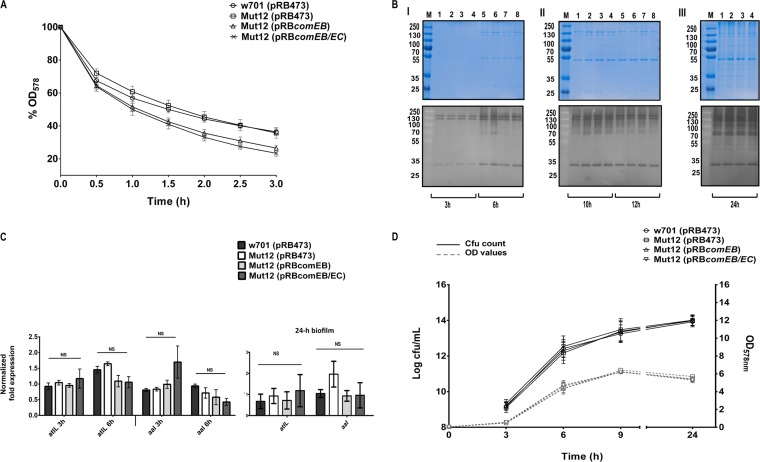
FIG 4.
comEB does not impact the expression of autolytic activities. (A) Mid-log-phase cells were treated with Triton X-100, and autolysis was monitored by the drop in OD578. The OD values are expressed in percentages, with the initial OD set to 100%. n = 3. Error bars indicate SEM. (B) Surface-associated proteins prepared from bacterial strains that were harvested at different time points of growth (3 h, 6 h [I], 10 h, 12 h [II], and 24 h [III]) were separated by SDS-PAGE on SDS gels and corresponding zymogram gels. Zymogram gels contained heat-inactivated S. lugdunensis cells in the separation gel. Bacteriolytic activities were observed as clear zones after overnight incubation in buffer. (Upper) SDS gels; (lower) corresponding zymogram gels. Molecular masses (in kilodaltons) of marker proteins (M) are indicated on the left. Lanes 1 and 5, w701(pRB473); 2 and 6, Mut12(pRB473); 3 and 7, Mut12(pRBcomEB); 4 and 8, Mut12(pRBcomEB/EC). SDS and zymogram gels are representative of three independent experiments. (C) The expression of the S. lugdunensis homologs of two major staphylococcal autolysin genes, atlL and aal, were analyzed by real-time PCR from cultures grown to mid-logarithmic (3 h) or stationary phase (6 h) or in 24-h biofilms. The values represent the averages from three independent experiments, and the error bars represent the SEM. The data were analyzed with one-way ANOVA and a Bonferroni's posttest. (D) Growth was initiated at a starting OD578 of 0.05 in TSB (37°C, 160 rpm) and monitored. At the indicated time points, the cultures were sampled, serially diluted, and plated on blood agar. Resulting colonies were counted after 24 h of incubation. The viability was expressed as log CFU/ml. n = 3. Error bars indicate SEM. NS, not significant.

