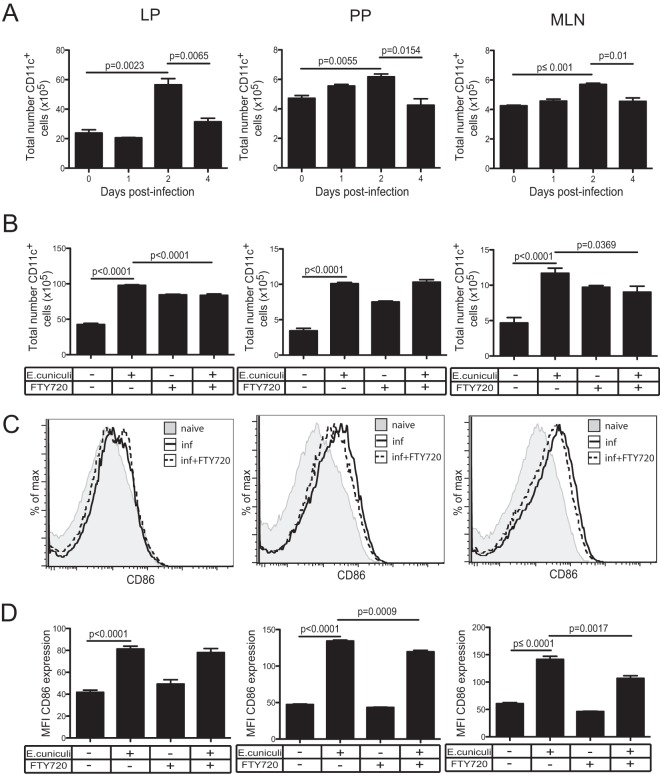
FIG 2.
DC activation at different mucosal sites. (A) The total numbers of MHC-II+ CD11c+ cells in the LP, PP, and MLN of C57BL/6 mice were determined at different time points after oral E. cuniculi infection. (B) Mice were either left untreated or treated with FTY720, and the numbers of CD11c+ cells in the LP, PP, and MLN were assessed at day 2 p.i. (C) The expression of CD86 by CD11c+ cells was measured in the LP, PP, and MLN at day 2 p.i. Histograms are gated on total CD11c+ cells. inf, infected. (D) Graphs depict the average MFI of CD86 for CD11c+ DC in each respective organ. The experiment was performed twice, and the data represent results of one experiment.

