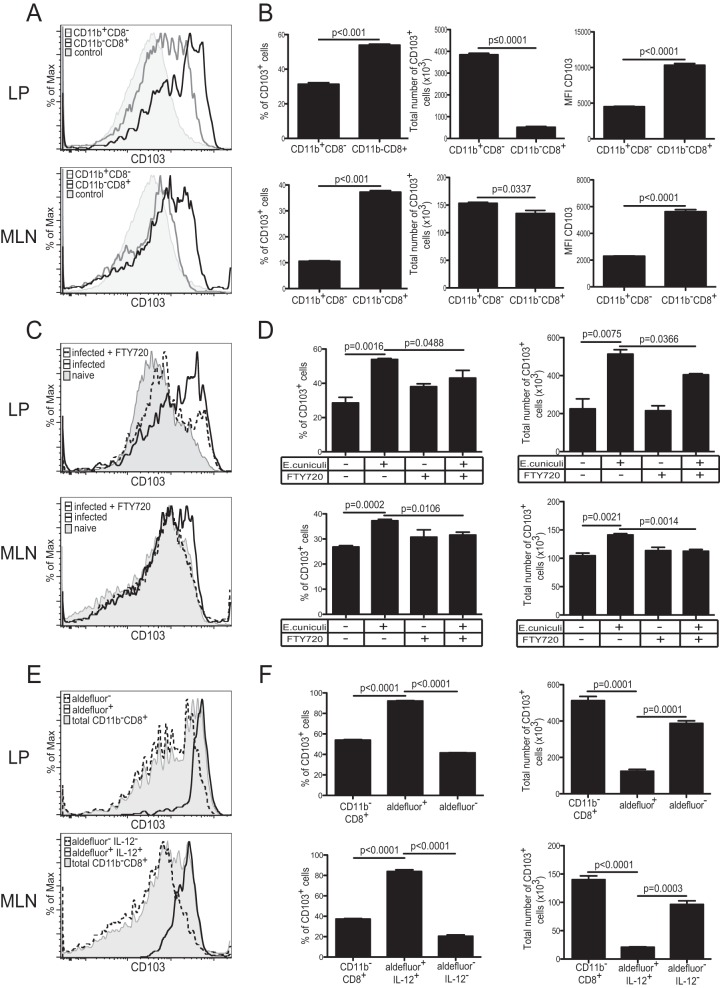
FIG 4.
CD103 expression by different DC subsets. (A) CD103 expression in CD11b+ CD8− (gray lines) and CD11b− CD8+ (black lines) DC in the LP and MLN of IL-12p40 YFP mice was measured at day 2 p.i. The negative control for CD103 expression is fluorescence minus one for the CD103 marker (shaded histograms). (B) Graphs represent the frequency or total number of CD103+ cells for each subset. The MFI for CD103 is also presented. (C) CD103 expression by the CD11b− CD8+ DC population from the LP and MLN of infected mice treated with FTY720 (dashed lines) or from those of infected nontreated mice (solid lines). CD103 expression by CD11b− CD8+ DC from naïve animals (shaded histograms) is presented as a control. (D) Graphs show the frequency or total number of CD103+ CD11b− CD8+ DC in the LP and MLN. (E) At day 2 p.i., CD103 expression in different DC subsets was compared in both the LP (total CD11b− CD8+ [shaded histogram], CD11b− CD8+ Aldefluor-positive [solid line], and CD11b− CD8+ Aldefluor-negative [dashed line] DC) and the MLN (total CD11b− CD8+ [shaded histogram], CD11b− CD8+ Aldefluor-positive IL-12+ [solid line], and CD11b− CD8+ Aldefluor-negative IL-12− [dashed line] DC). (F) Graphs depict frequencies or total numbers of CD103+ cells for the same DC subsets in the MLN and LP of E. cuniculi-infected mice. Data represent results of at least 2 experiments with 3 mice/group.

