Figure 3.
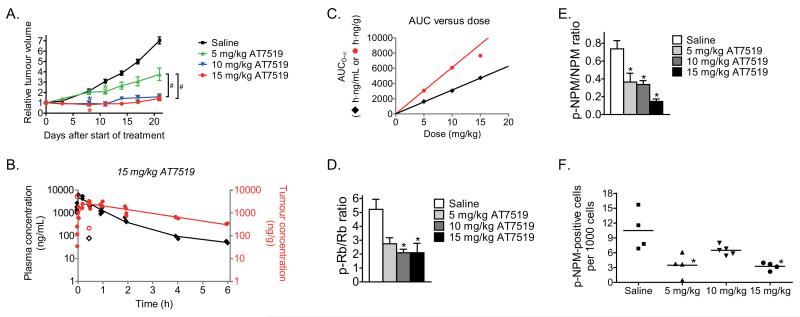
Loss of Rb and NPM phosphorylation are biomarkers for the inhibitory effects of AT7519 on the growth of MYCN-amplified AMC711T neuroblastoma xenografts in mice. A, inhibitory effects of AT7519 on the growth of AMC711T neuroblastoma xenografts in mice. Relative tumour volume was calculated as the volume at the indicated day after start of treatment divided by the volume prior to treatment initiation. Data represent the mean relative tumour volume +/− S.E.M. (Group sizes: n = 10 (saline), n = 8 (5 mg/kg), n = 8 (10 mg/kg) and n = 11 (15 mg/kg)). Statistical differences between AT7519 treated and saline treated groups are indicated on the first day after treatment initiation at which a statistically different effect was observed (*). Statistical differences between the different doses AT7519 are indicated as #. B, plasma and intratumoural drug levels after administration of a single i.p. injection of 15 mg/kg AT7519 to mice bearing MYCN-amplified AMC711T neuroblastoma xenografts. Plasma AT7519 concentrations established at 1 min after administration have been averaged for curve fitting. Each symbol represents a single data point (tumour, solid red circles; plasma, solid black diamonds) and continuous lines represent the fitted curves. Outliers were calculated using Dixon’s Q-test at a 95% confidence level. One tumour sample (i.e. 214.3 ng/g AT7519 at 0.5 h after administration) has been considered outlier based on corresponding plasma levels. Outliers are indicated by unfilled red circles for tumour samples and unfilled black diamonds for plasma samples. C, in vivo correlation between drug exposure (AUC0-∞) and AT7519 dose (tumour, red circles; plasma, black diamonds). D and E, in vivo inhibitory effects of AT7519 on the tumour phosphorylation states of the CDK2 targets Rb (D) and NPM (E). Phosphorylation states have been expressed as the ratio between phosphorylated and non-phosphorylated protein levels. β-actin was used as household protein. Data represent mean values +/− S.E.M. (n = 4 per group). F, in vivo inhibitory effects of AT7519 on phosphorylated NPM levels were confirmed by immunohistochemistry. Quantification was performed by manual counting of the number of p-NPM-positive cells in 40 microscopic fields per mouse sample at 40× magnification. The total cell number per field was estimated from hematoxylin-eosin stained tumour sections. Each symbol in the graph represents the average number of p-NPM-positive cells per 1000 cells for each individual mouse.
All statistical differences were calculated using one-way analysis of variance (ANOVA) Bonferroni adjustment and are indicated as *, unless stated otherwise. P-values < 0.05 were considered significant.

