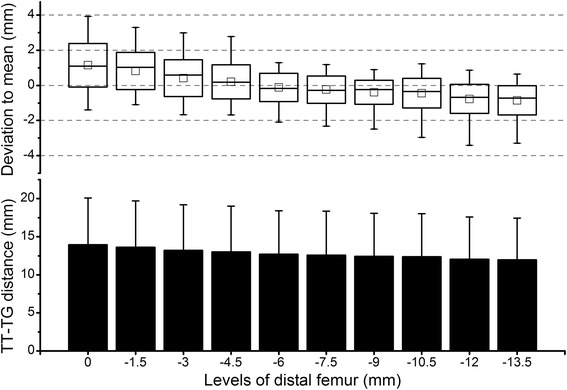
Fig. 5.

Results of the cartilaginous-MRI group. Column plot shows the tibial tubercle-trochlear groove (TT-TG) distance of all 30 subjects at various levels of the distal femur. On the X-axis, the level of the trochlear entrance was defined as 0; the distal to the trochlear entrance was defined as negative. Box plot shows the deviation of the TT-TG distance at each level in relation to the average value across levels. The square in the box indicates the mean, the line indicates the median, the upper and lower ends of the box indicate one standard deviation, and the whiskers indicate the range of all values
