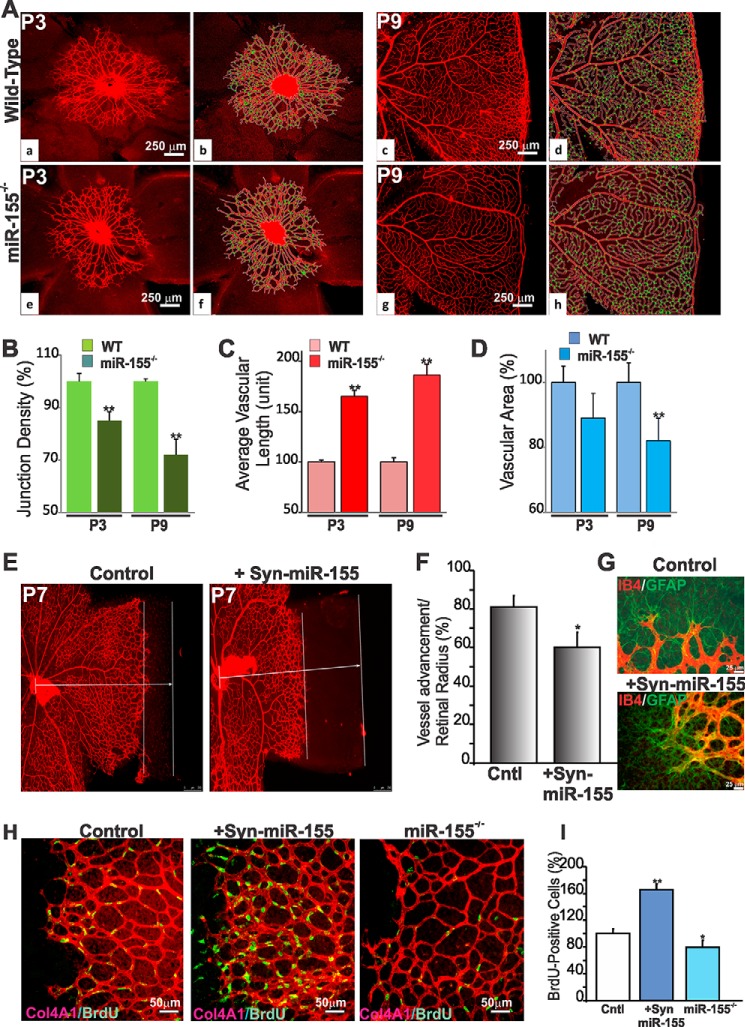
FIGURE 3.
Effects of miR-155 expression and deficiency on retinal vessel growth and development. A, representative immunofluorescence images of IB4-stained whole mount retinas at P3 and P9 of wild-type and miR-155−/− mice. Vascular parameters were analyzed using the AngioTool software. The outline of the vasculature is shown in white, the vasculature skeleton representation is shown in red, and branching points are green (b for a, d for c, f for e, and h for g). Note the strong and dense vascular network in wild-type compared with miR-155−/− mouse retinas. B–D, quantitative analysis of vascular parameters of representative retinas of WT and miR-155−/− mice. Graphical representations of the analysis of junction density (B), vascular length (C), and vascular area (D) are shown. **, p < 0.05 versus same age WT (n = 5). E, effects of miR-155 mimics on retinal vascular development. IB4-labeled vasculature of whole retinal mounts at P6 after Syn-miR-255 treatment at P3. Control mice were injected with scrambled control miRNA. Parallel bars represent distance between the vascular front and the retinal edge. F, quantification of sprouting distance in wild-type mice injected with control or Syn-miR-155. Vascular progression as a function of the retinal radius is shown. *, p < 0.05 versus control (Cntl) (n = 4). G, IB4- and GFAP-labeled whole retinal mounts of wild-type mice injected with scrambled miRNA or Syn-miR-155. Note that endothelial cell sprouting along GFAP-positive astrocytes similarly occurred in control and Syn-miR-155-injected eyes. H, effects of miR-155 gain or loss of function on endothelial cell growth during retinal vessel development. Whole mount retina images of BrdU incorporation (green) together with IB4 staining (red) at P6 of wild-type, Syn-miR-155-injected, and miR-155−/− mice. I, proliferation index at P6 was measured by counting BrdU-positive nuclei. Equivalent areas of retinas of scrambled control miRNA-injected wild-type, Syn-miR-155-injected, and miR-155−/− mice were analyzed. Data are means ± S.E. (error bars). *, p < 0.05; **, p < 0.001 versus wild-type control (Cntl) (n = 5).

