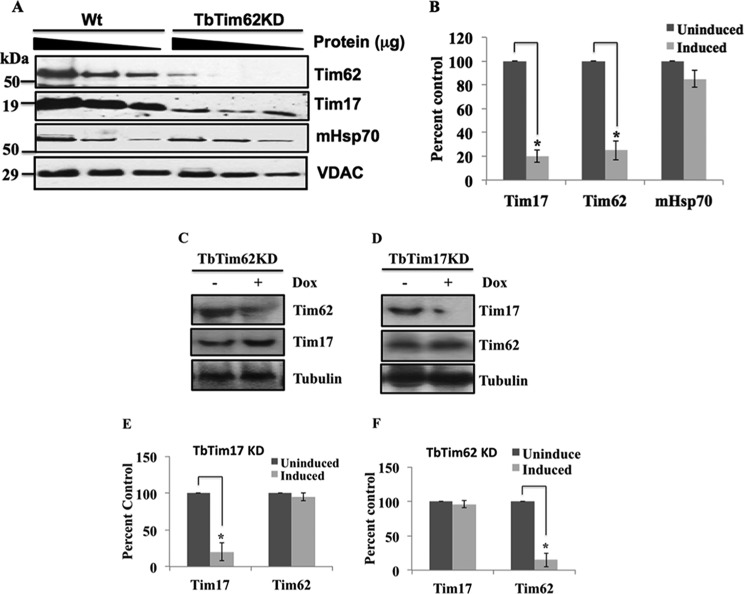
FIGURE 4.
Effect of TbTim62 knockdown on the steady-state levels of TbTim17 protein and transcript. A, mitochondria were isolated from the T. brucei procyclic form Wt and from TbTim62 RNAi cells grown for 4 days in the presence of doxycycline. Mitochondrial proteins (100, 50, and 25 μg) were analyzed by immunoblot analysis using TbTim17, TbTim62, mHsp70, and VDAC antibodies as probes. B, the intensity of the respective protein bands were quantitated using imaging densitometer as described under “Experimental Procedures” normalized with the corresponding VDAC protein bands and plotted as percent in the WT control. S.E. are calculated from three independent experiments. C and D, TbTim17 RNAi and TbTim62 RNAi cells lines were cultured in the presence (+) and absence (−) of doxycycline for 2 days. Total RNAs were isolated and analyzed by Northern blot analysis using cDNAs for TbTim62 and TbTim17 as probes as indicated. Tubulin was used as the control for Northern blot. E and F, the intensity of the respective bands were quantitated using imaging densitometer as described, normalized with the corresponding tubulin band, and plotted as percent in the respective un-induced controls. S.E. are calculated from four independent experiments. *, p values <0.05.

