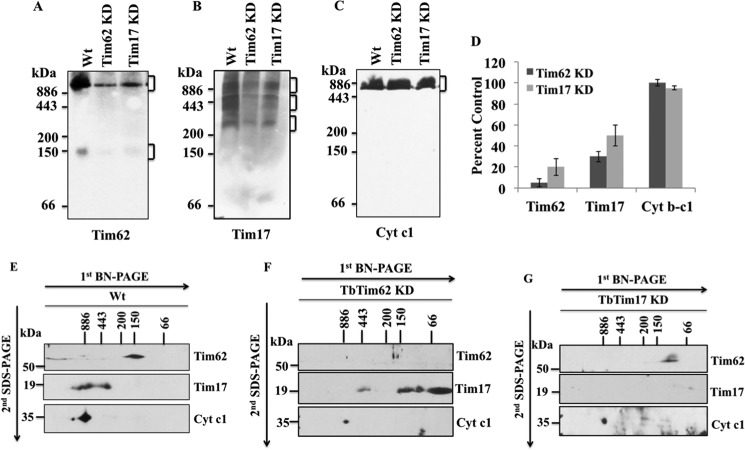
FIGURE 7.
Analysis of the mitochondrial protein complexes containing TbTim62 and TbTim17. Mitochondria were isolated from T. brucei wild type, TbTim62 KD, and TbTim17 KD cells after 4 days induction of RNAi with doxycycline. Mitochondria (100 μg) samples were solubilized with digitonin (1.0%). The solubilized supernatant were clarified by centrifugation at 100,000 × g and analyzed by BN-PAGE. Protein complexes (as indicated by the bracket at the right side of the blot) were detected by immunoblot analysis using antibodies for TbTim62 (A), TbTim17 (B), and Cyt c1 (C). The Cyt c1 antibody recognized the cytochrome b-c1 reductase complex. Molecular size marker proteins apoferritin dimer (886 kDa), apoferritin monomer (443 kDa), β-amylase (200 kDa), alcohol dehydrogenase (150 kDa), and bovine serum albumin (66 kDa) were run on the gel and visualized by Coomassie Blue staining. D, intensity of the Tim62 (∼150 and ∼1100 kDa), Tim17 (∼300 to ∼1100 kDa), and cytochrome b-c1 (∼700 kDa) protein complexes were quantitated by imaging densitometry. The intensity of these complexes in TbTim62 KD and TbTim17 KD mitochondria were calculated as percent of that in Wt control and plotted. S.E. are calculated from three independent experiments. E–G, gel strips representing individual lanes for Wt (E), TbTim62 KD (F), and TbTim17 KD (H) were excised from the first-dimensional gel and subjected to 12% Tricine SDS-PAGE. Proteins were transferred to a nitrocellulose membrane, and blots were sequentially probed with anti-TbTim17, anti-TbTim62, and anti-Cyt c1 antibodies.

