
FIGURE 8.
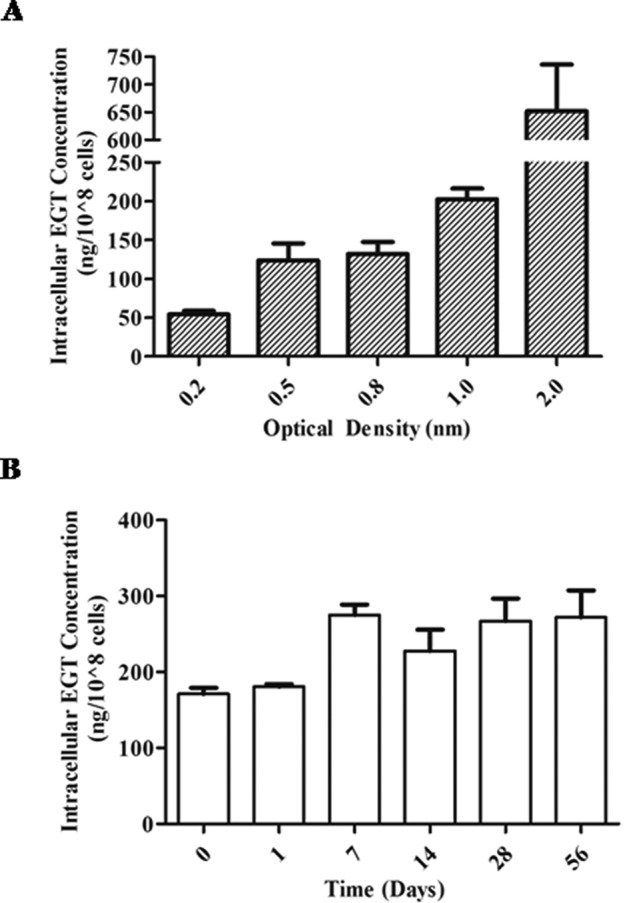
Intracellular EGT levels in H37Rv wild type under nutrient rich and starvation conditions. A, ESI LC-MS/MS quantification of intracellular EGT levels of M. tuberculosis at different stages of growth. Cultures were grown in Middlebrook 7H9 supplemented with 0.2% glycerol, 10% OADC, and 0.05% tyloxapol, and EGT was extracted from each culture at various optical densities. B, monitoring intracellular EGT levels under starved cultures. M. tuberculosis was starved in standing cultures for up to 6 weeks in PBS containing 0.05% tyloxapol. EGT was extracted from M. tuberculosis at weekly intervals for quantification by ESI LC-MS/MS. Both A and B are expressed as mean of three independent experiments ± S.E. (error bars).