FIGURE 2.
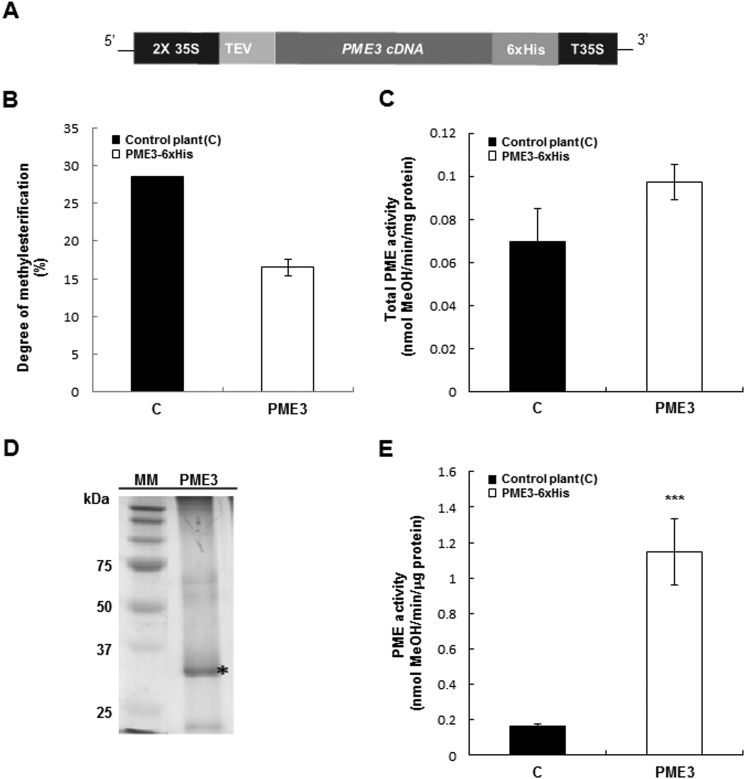
PME3-His6 is processed properly and is active in transgenic N. tabacum plants. A, transgenic N. tabacum plants overexpressing PME3-His6 were generated. Expression of PME3 under the control of a double CaMV 35S promoter and a 35S transcriptional terminator/polyadenylation sequence (T35S) was carried out using a binary vector. The PME coding region was fused to the TEV sequence for enhanced transcription and to the His6 tag for affinity purification. B, DM in control plants (■) and transgenic tobacco plants overexpressing PME3-His6 (□). DM was calculated as described (51). Data represent mean values ± S.E. (error bars) from three replicates. No significant differences were shown with non-parametric Wilcoxon-Mann-Whitney test. C, PME activity from total protein extract of control plants (■) and the PME3-His6-overexpressing line (□). Data represent means ± S.E. from three independent samples. According to Student's t test, no significant differences are shown. D, Ni-NTA-purified PME3-His6 analysis by SDS-PAGE. MM, molecular mass marker. PME3, Purified PME3-His6 (*). E, PME activity from Ni-NTA retained the fraction of control plants (■) and a representative PME3-His6-overexpressing line (□). For determination of PME activity, assays were performed according to the method adapted from Ref. 43. Data represent mean values ± S.E. from three independent samples. Significant differences were determined with Student's t test (***, p < 0.001).

