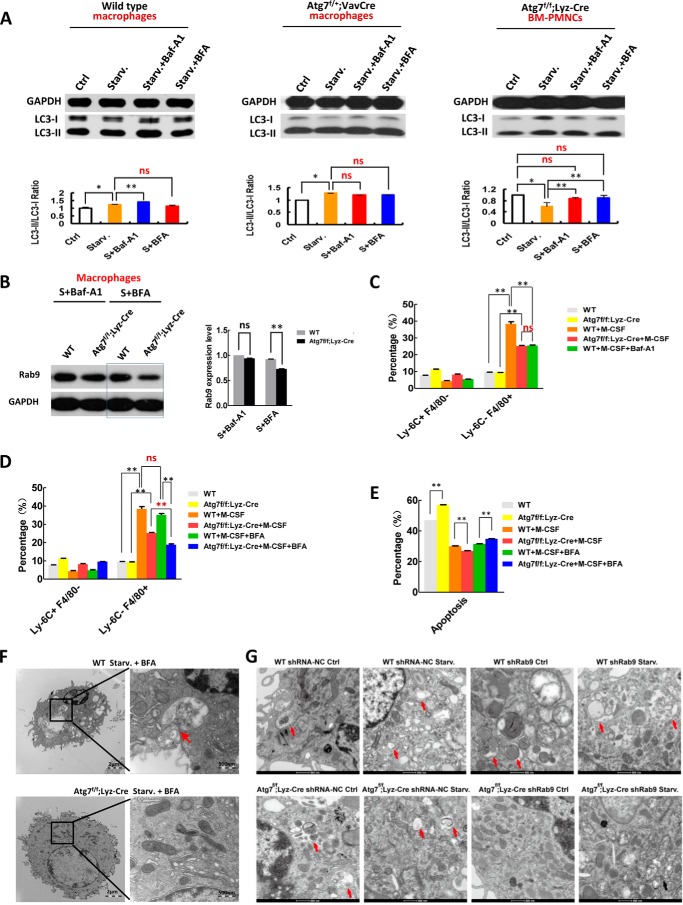
FIGURE 5.
Brefeldin A treatment or knockdown of Rab9 inhibits alternative autophagic response in atg7-deleted macrophages. Examination of canonical autophagic flux in response to starvation (1.5 h) with/without bafilomycin A1 (Baf-A1) or brefeldin A (BFA, 0.1 ng/ml, a specific inhibitor on atg7-independent autophagy) in macrophages of wild-type mice (left), Atg7f/+;Vav-Cre heterozygous mice (middle), and in peripheral mononuclear cells (PMNCs) of Atg7f/f;Lyz-Cre homozygous mice (right) by Western analysis. Representative Western blotting results (upper panels) and statistical data of three independent experiments (lower panels) are shown. B, BFA but not Baf-A1 downregulated Rab9 level of macrophages from Atg7f/f;Lyz-Cre mice in response to autophagy stimuli (starvation 1.5 h). Macrophages from wild-type mice served as a control. A representative Western blotting result (left) and quantative data (right) are shown. C, atg7-deleted macrophages of Atg7f/f;Lyz-Cre mice showed an inhibition on M-CSF induced monocyte-macrophage differentiation to the same degree as Baf-A1 inhibition on the M-CSF induced monocyte-macrophage differentiation of wild-type mice. D, BFA but not Baf-A1 inhibits M-CSF induced monocyte-macrophage differentiation in atg7-deleted myeloid cells of Atg7f/f;Lyz-Cre mice. Representative colony-forming results (right) and statistical data (left) are shown. E, BFA inhibition on monocyte differentiation increases apoptosis of atg7-deleted monocytes of Atg7f/f;Lyz-Cre mice. F, transmission electron microscopic analysis of macrophage autophagy in response to starvation treated with or without Brefeldin A (0.1 ng/ml). Macrophages were isolated from wild-type mice or Atg7f/f;Lyz-Cre mice and followed by starvation for 90 min. Autophagosomes and autolysosomes are shown in the representative TEM images. G, knockdown of Rab9 crippled autophagy response in atg7-deleted, but not wild-type macrophages. Red arrows: autophagosmes or autolysosomes; black arrows: damaged mitochondria. Data are representative or statistical results of three experiments. n ≥ 6. *, p < 0.05; **, p < 0.01.

