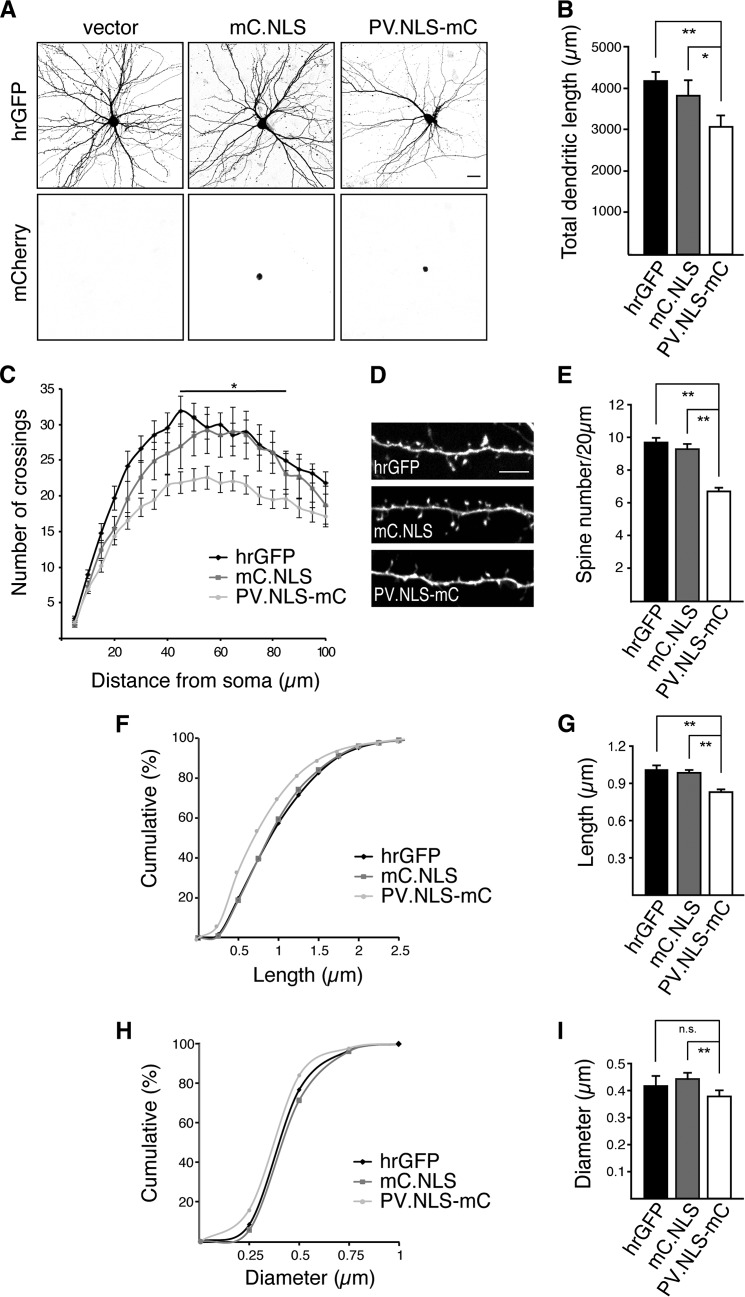
FIGURE 2.
Nuclear expression of the calcium buffer parvalbumin affects neuronal morphology. A, representative micrographs of cultured hippocampal neurons transfected with an expression vector for hrGFP or cotransfected with expression vectors for hrGFP and mC.NLS or PV.NLS-mC as indicated. GFP fluorescence (top row) reveals neuronal architecture. mCherry fluorescence (bottom row) shows nuclear localization of mC.NLS and PV.NLS-mC. Scale bar = 20 μm. B, quantification of the total dendritic length of hippocampal neurons transfected as indicated. Statistically significant differences were determined by one-way ANOVA followed by Tukey's post hoc test. hrGFP, PV.NLS-mC, p = 0.009557; mC.NLS, PV.NLS-mC, p = 0.04021. C, Sholl analysis of hippocampal neurons transfected as indicated. D, representative micrographs of dendritic spines of hippocampal neurons transfected as in A. Scale bar = 5 μm. E, quantification of dendritic spine density of neurons transfected as in A. Statistically significant differences were determined by one-way ANOVA followed by Tukey's post hoc test. hrGFP, PV.NLS-mC, p = 0.0000103; mC.NLS, PV.NLS-mC, p = 0.00001033. F and H, cumulative frequency plots of spine length and width from neurons transfected as indicated. G and I, average spine lengths and widths from neurons transfected with the indicated constructs. Statistically significant differences were determined by one-way ANOVA followed by Tukey's post hoc test: Spine length: hrGFP, PV.NLS-mC, p = 0.0006633; mC.NLS, PV.NLS-mC, p = 0.003244. Spine width: hrGFP, PV.NLS-mC, p = 0.1066; mC.NLS, PV.NLS-mC, p = 0.002185. More than 2300 spines and 12 neurons from a minimum of three independent preparations were examined for each construct. ns, not significant.*, p < 0.05; **, p < 0.01.

