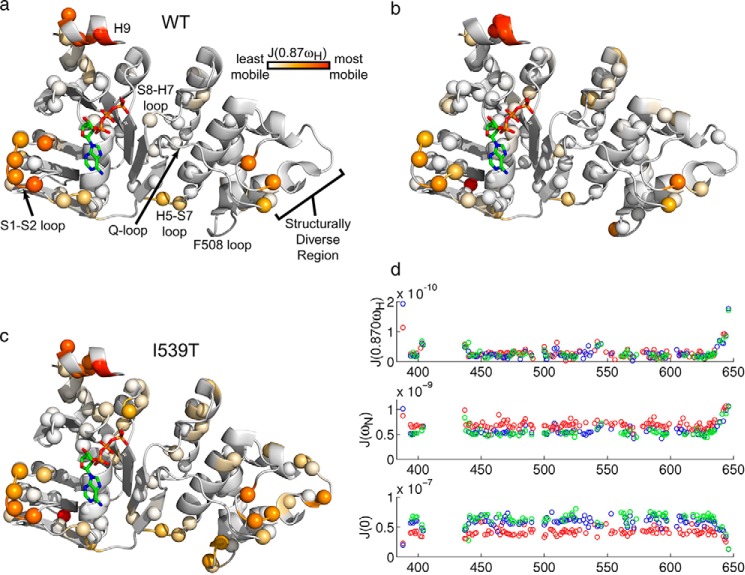
FIGURE 5.
Spectral density function J(0. 87ωH) ribbon diagram plots for WT (a), F508del (b), and I539T NBD1 ΔRIΔRE (c) are shown. Data points for specific residues are plotted as spheres that are colored according to the legend, from white to orange to red reflecting the range from least to most mobile. d, spectral density functions at three different frequencies as a function of NBD1 residue number for WT (green), F508del (red), and I539T (blue).

