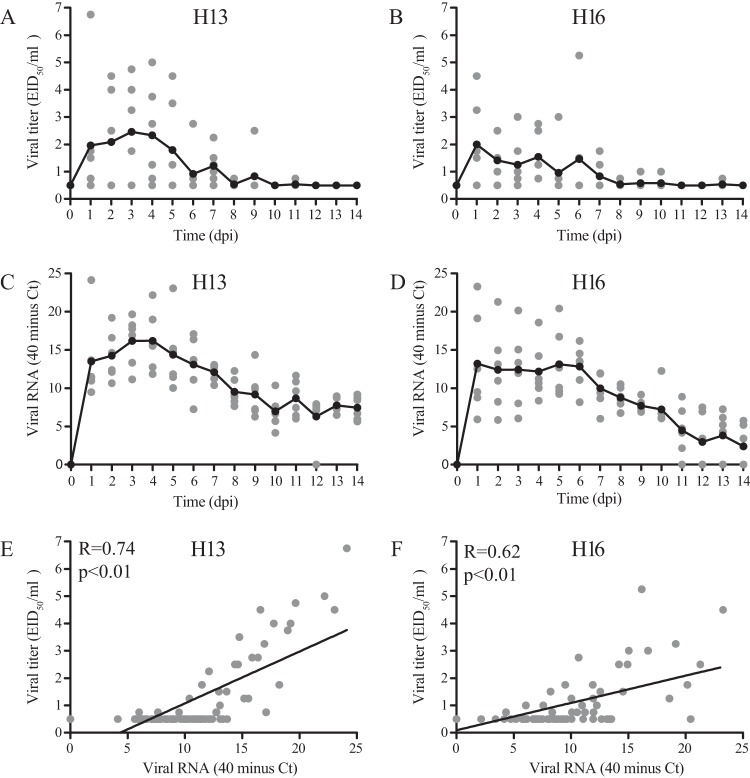
FIG 1.
Comparison of viral titers with viral RNA in cloacal swabs after the first LPAIV H13N2 and H16N3 inoculations of black-headed gulls. (A, C, and E) H13; (B, D, and F) H16. Black lines indicate means per sampling day (A to D), and gray dots indicate values for individual birds (n = 6 birds per day) (A to F). Correlation analyses for H13 and H16 based on viral titers and viral RNA from days 0 to 14 postinoculation resulted in R values of 0.74 for H13 (P < 0.01) and 0.62 for H16 (P < 0.01) (Pearson correlation test).

