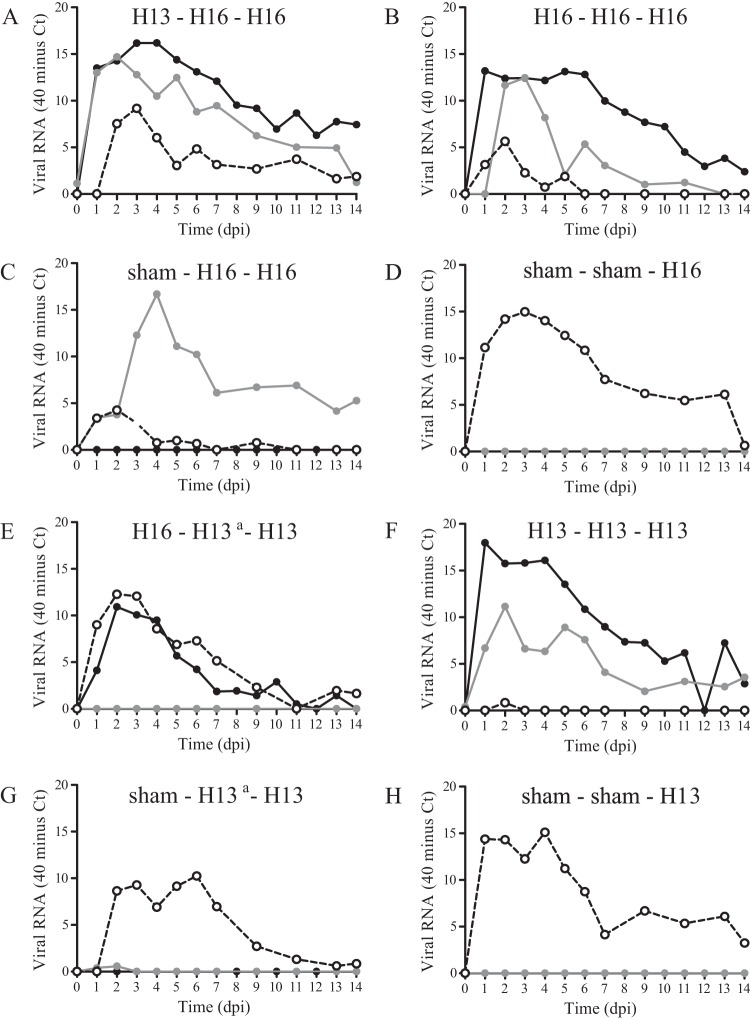
FIG 2.
Mean virus excretion from cloaca after experimental infection of black-headed gulls with one or more inoculations of LPAIV H13N2, LPAIV H16N3, or both, based on the quantity of viral RNA (i.e., CT values determined by M-RT-PCR). Each panel represents data from one group. Mean virus excretion is based on data for all birds in the group. Black lines indicate the first inoculation, gray lines indicate the second inoculation, and dashed lines indicate the third inoculation. a, the second inoculation of groups 5 and 7 was unsuccessful.

