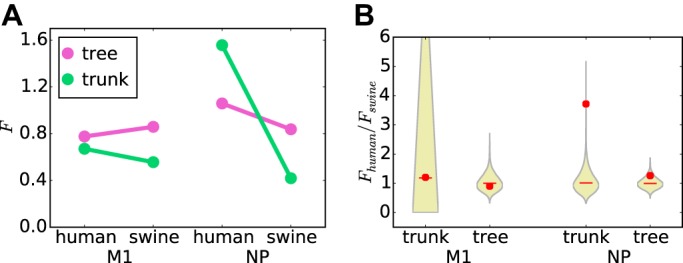
FIG 5.

The average substitution changes more NP epitopes in human influenza than swine influenza virus. The F statistic is the average number of epitopes altered per substitution. (A) The average substitution alters a similar number of epitopes in M1 proteins of both human and swine influenza viruses and for both the entire tree and the trunk alone. However, for NP, the average substitution alters substantially more epitopes in human than in swine influenza virus, particularly along the trunk of the tree. (B) The increased rate of epitope-altering substitutions in NP along the trunk of human versus swine influenza virus is statistically significant. The violin plots show the null distribution of the ratio of F for human influenza virus to that for swine influenza virus, with the median shown by the red lines and the actual value shown by red circles. The P values (fraction of the null distribution that is greater than or equal to the actual value) are 0.49 for the M1 trunk, 0.65 for the M1 tree, 0.0002 for the NP trunk, and 0.098 for the NP tree.
