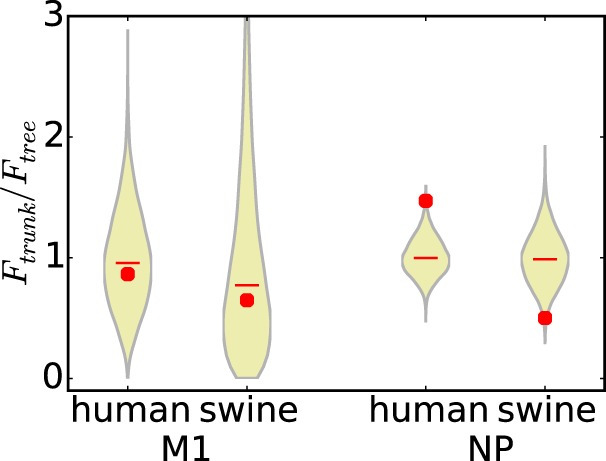
FIG 6.

Epitope-altering substitutions in human influenza virus NP are enriched on the trunk of the tree. Ratios of the average number of epitopes altered per substitution (F) for the trunk to that for the entire tree are shown. The violin plots show the actual values versus the null distributions, as described in the legend of Fig. 5B. There is no difference between the trunk and the entire tree for M1 (P values are 0.59 for M1 of human influenza virus and 0.57 for M1 of swine influenza virus). However, for NP, epitope-altering substitutions are significantly enriched on the trunk of the human influenza virus tree relative to the rest of the tree (P = 0.003) and significantly depleted on the trunk of the swine influenza virus lineage (P = 0.01 for depletion) relative to the rest of the tree.
