FIG 8.
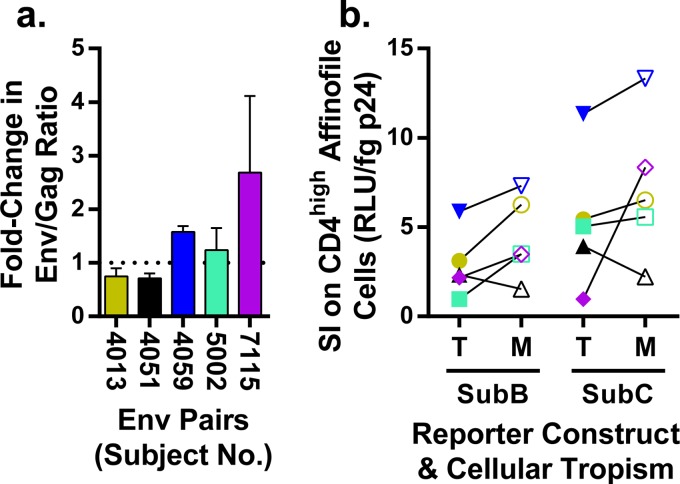
M-tropic Env proteins are incorporated at levels similar to those of T-tropic Env proteins. (a) Western blot analysis was used to evaluate the relative incorporation of Env proteins into virions using five pairs of T-tropic and M-tropic Env-pseudotyped viruses. For each virus, the abundance of Env protein was detected by Western blotting normalized to the abundance of Gag. The normalized values of Env proteins in M-tropic viruses were compared to those of subject-matched T-tropic viruses and reported as the fold change value of M-tropic over T-tropic Env protein incorporation. The fold change values (mean = 1.4, SD = 0.8) were not found to deviate significantly from a hypothetical mean of 1 (tpaired = 1, df = 4, P value = 0.3), which represents the null hypothesis of an equal abundance of Env proteins on the surface of viruses expressing T-tropic and M-tropic Env proteins. (b) Five paired T-tropic (T, closed symbols) and M-tropic (M, open symbols) env genes were pseudotyped with an env-deficient HIV-1 genome that was either subtype B with a firefly luciferase reporter gene (SubB) or subtype C with a Renilla luciferase reporter gene (SubC). Virion density was represented by p24 concentration and the titers of infectivity were determined on CD4high Affinofile cells. The specific infectivity (SI) values reported are the linear relationship of infectivity (RLU) per virion as represented by a structural protein product, p24-Gag (fg). Although the subtype C construct gives overall higher SI values, the effects of HIV-1 subtypes cannot be directly compared, because different reporters are used. Despite a small apparent trend of increased SI of M-tropic viruses in both reporter constructs, any differences in SI between paired T-tropic and M-tropic viruses are not significant when taken together (Wpaired = 13, P value = 0.13) or separated by reporter construct (for SubB, Wpaired = 13, P value = 0.13; for SubC, Wpaired = 9, P value = 0.31). Also, because the CD4 density on CD4high Affinofiles is saturating for M-tropic viruses and not saturating for T-tropic viruses, the SI values for T-tropic viruses are likely an underestimate, which may account for a slight reduction in the observed SI for T-tropic viruses compared to that for M-tropic viruses.

