FIG 4.
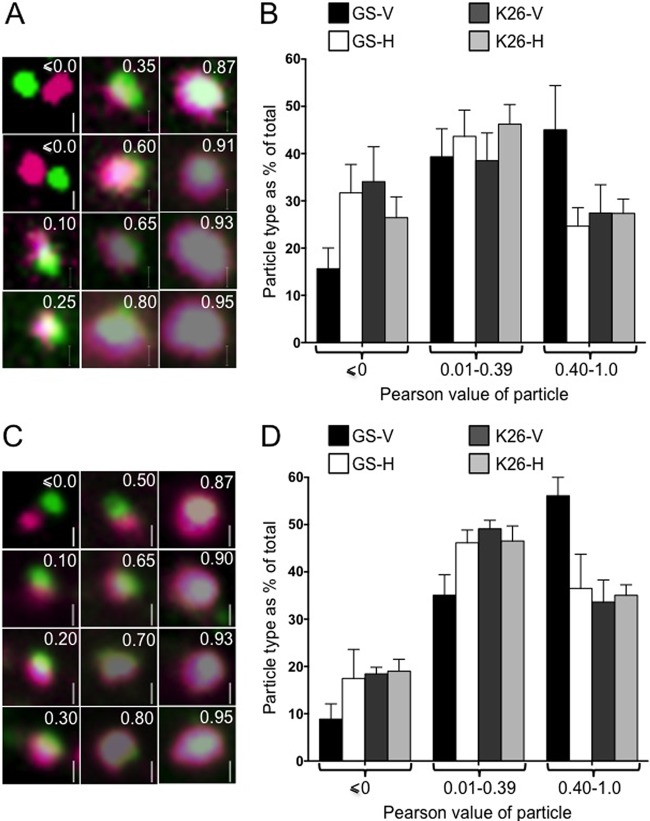
Appearance of fluorescent cytoplasmic HSV capsid-membrane particles in the presence and absence of UL36p. PNS samples were isolated from K26GFP- or HSV1-GS2491-infected Vero or HS30 cells (labeled according to virus strain and cell line as in Fig. 1), and then fields of HSV particles were stained with fluorescent lipophilic dyes and imaged. Pearson correlation values were determined for the capsid and lipophilic dye fluorescence of individual particles. (A) Representative gallery of DiD-stained particles imaged in the green (capsid) and Cy5 (infrared, DiD) channels. In each panel, the Pearson value of the particle is shown in the upper right, and a 500-nm vertical scale bar in the lower right. (B) Numbers of particles falling within each of three different Pearson value ranges (shown below the graph) plotted as a percentage of the total. Plotted values are means and standard deviations from the means. Numbers of individual particles counted were 1,457 (GS-V), 1,363 (GS-H), 1,083 (K26-V), and 1,229 (K26-H). The numbers of HSV1-GS2491 particles with Pearson values less than or equal to zero and also those with values between 0.4 and 1.0 differed significantly depending upon whether they had been isolated from Vero or HS30 cells (P < 0.0001 and P < 0.001, respectively, for the two Pearson ranges). (C, D) Similar to the data in panels A and B but using the lipophilic dye DilC18(5)-DS. Numbers of individual particles counted were 1,917 (GS-V), 2,392 (GS-H), 1,704 (K26-V), and 1,801 (K26-H). As described for panel B, the distribution of Pearson values was significantly different for HSV1-GS2491 particles depending on whether they originated from Vero or HS30 cells (P < 0.05 for Pearson values less than or equal to zero, P < 0.01 for values in the range of 0.4 to 1.0).

