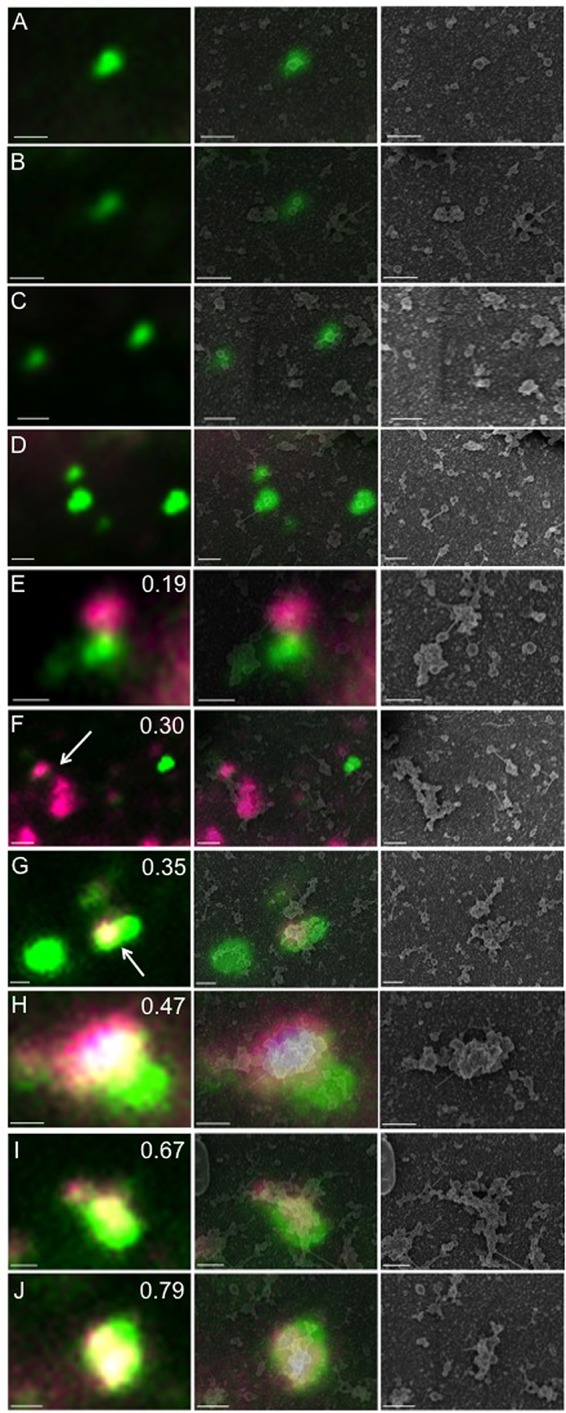
FIG 6.

Correlative light and electron microscopic analysis of cytoplasmic HSV particles. Cytoplasmic particles from HSV1-GS2491-infected Vero cells were prepared, stained with DilC18(5)-DS, and fixed as described for Fig. 3 and 4. After fluorescence imaging, the sample was processed for scanning electron microscopy (SEM), and then SEM and fluorescence images were aligned. In each horizontal row, the fluorescence image is shown in the left-hand panel, an alignment of the fluorescence and SEM images is in the middle panel, and the SEM image alone is in the right-hand panel. Bar, 500 nm. (A to D) Dye-negative green fluorescent particles. (E to J) Lipophilic dye-positive green fluorescent particles. The Pearson correlation coefficient is shown in the upper right of each left-hand panel. In panels F and G, the white arrow indicates the particle for which a Pearson value was determined.
