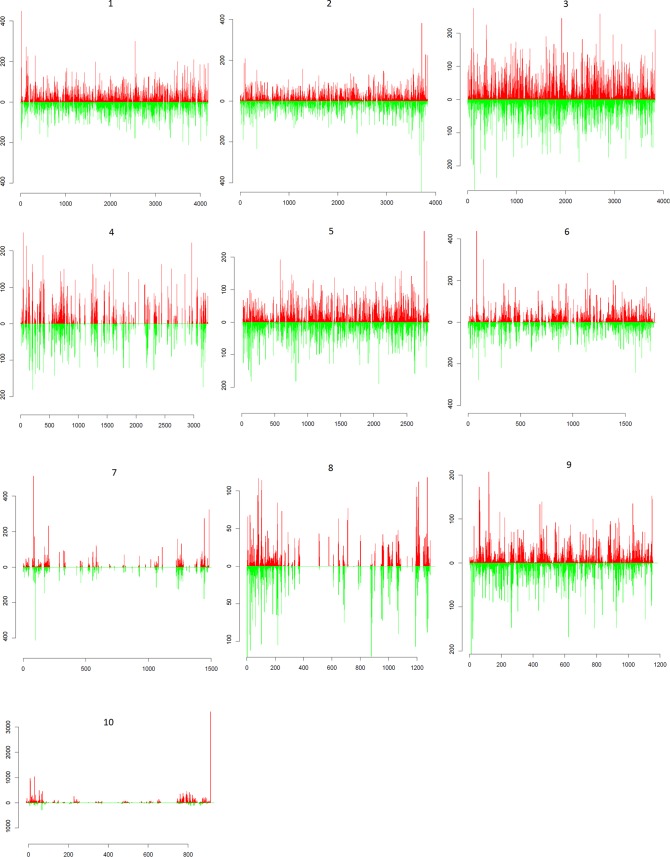
FIG 3.
Distribution profile of BmCPV-derived 20-nt vsRNAs from midgut samples of pathogenically infected second-instar larvae (2inf). Horizontal axes depict the nucleotide sequence positions of 1 to 10 viral segments in 5′→3′ direction for the positive strand and in a 3′→5′ direction for the negative strand. RNAs mapped to the positive and negative strands are represented by red and green bars, respectively. Vertical axes show the number of vsRNA reads.

