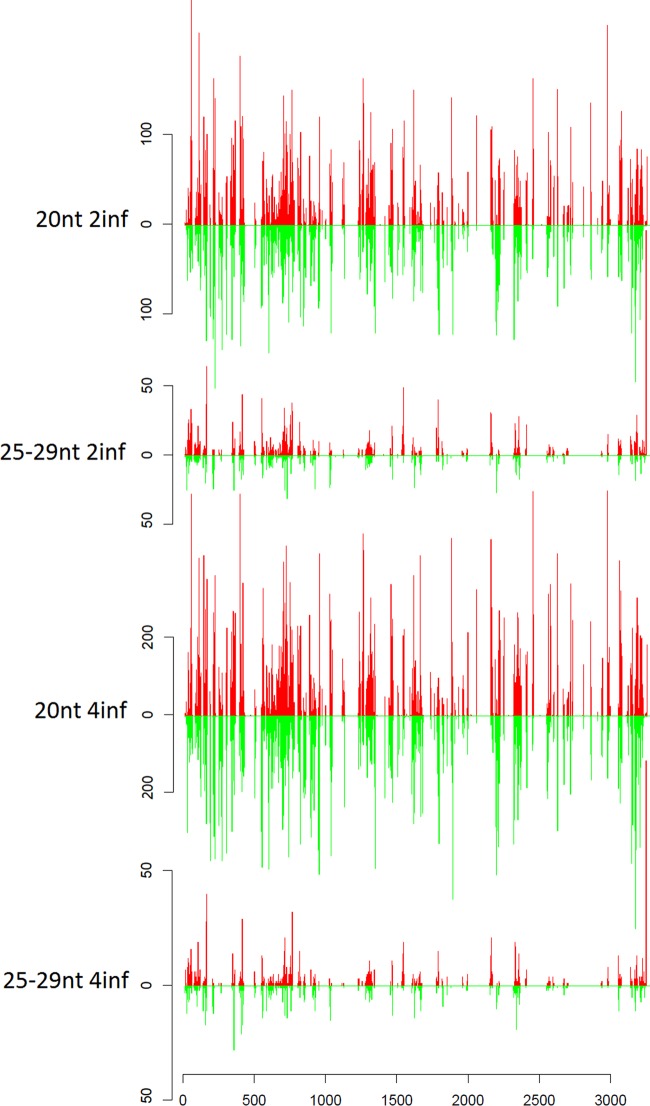
FIG 7.
Distribution profiles of the 20-nt and 25- to 29-nt vsRNA classes that map to S4 of BmCPV from the 2inf and 4inf samples. Horizontal axes depict the nucleotide sequence position in a 5′→3′ direction for the positive strand and the 3′→5′ direction for the negative strand. The abundances of vsRNAs mapping to the positive and negative strands are represented by red and green bars, respectively. Vertical axes show the number of vsRNA reads.

