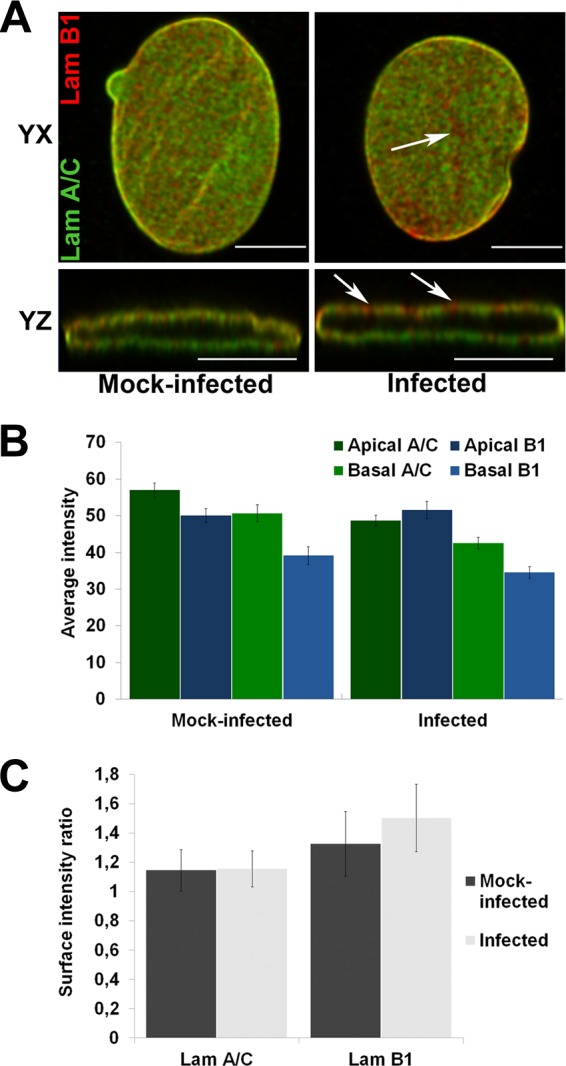
FIG 2.

Distributions of lamin A/C and lamin B1. (A) Confocal yx and yz cross sections taken through the nucleus show localization of lamin A/C (Lam A/C) (green) and lamin B1 (Lam B1) (red) Abs in mock-infected (left) and infected (right) cells. Arrowheads show lamin B1-enriched areas. (B) Average intensities of lamin A/C and B in apical and basal sides of NE. (C) Surface intensity ratio between the apical and basal sides for both lamins individually per ImageJ analysis. Error bars represent the 95% confidence intervals. Bars, 10 μm.
